In this lab, we are trying to verify the validity of the concepts we have discussed about Impulse:
Lab Set Up
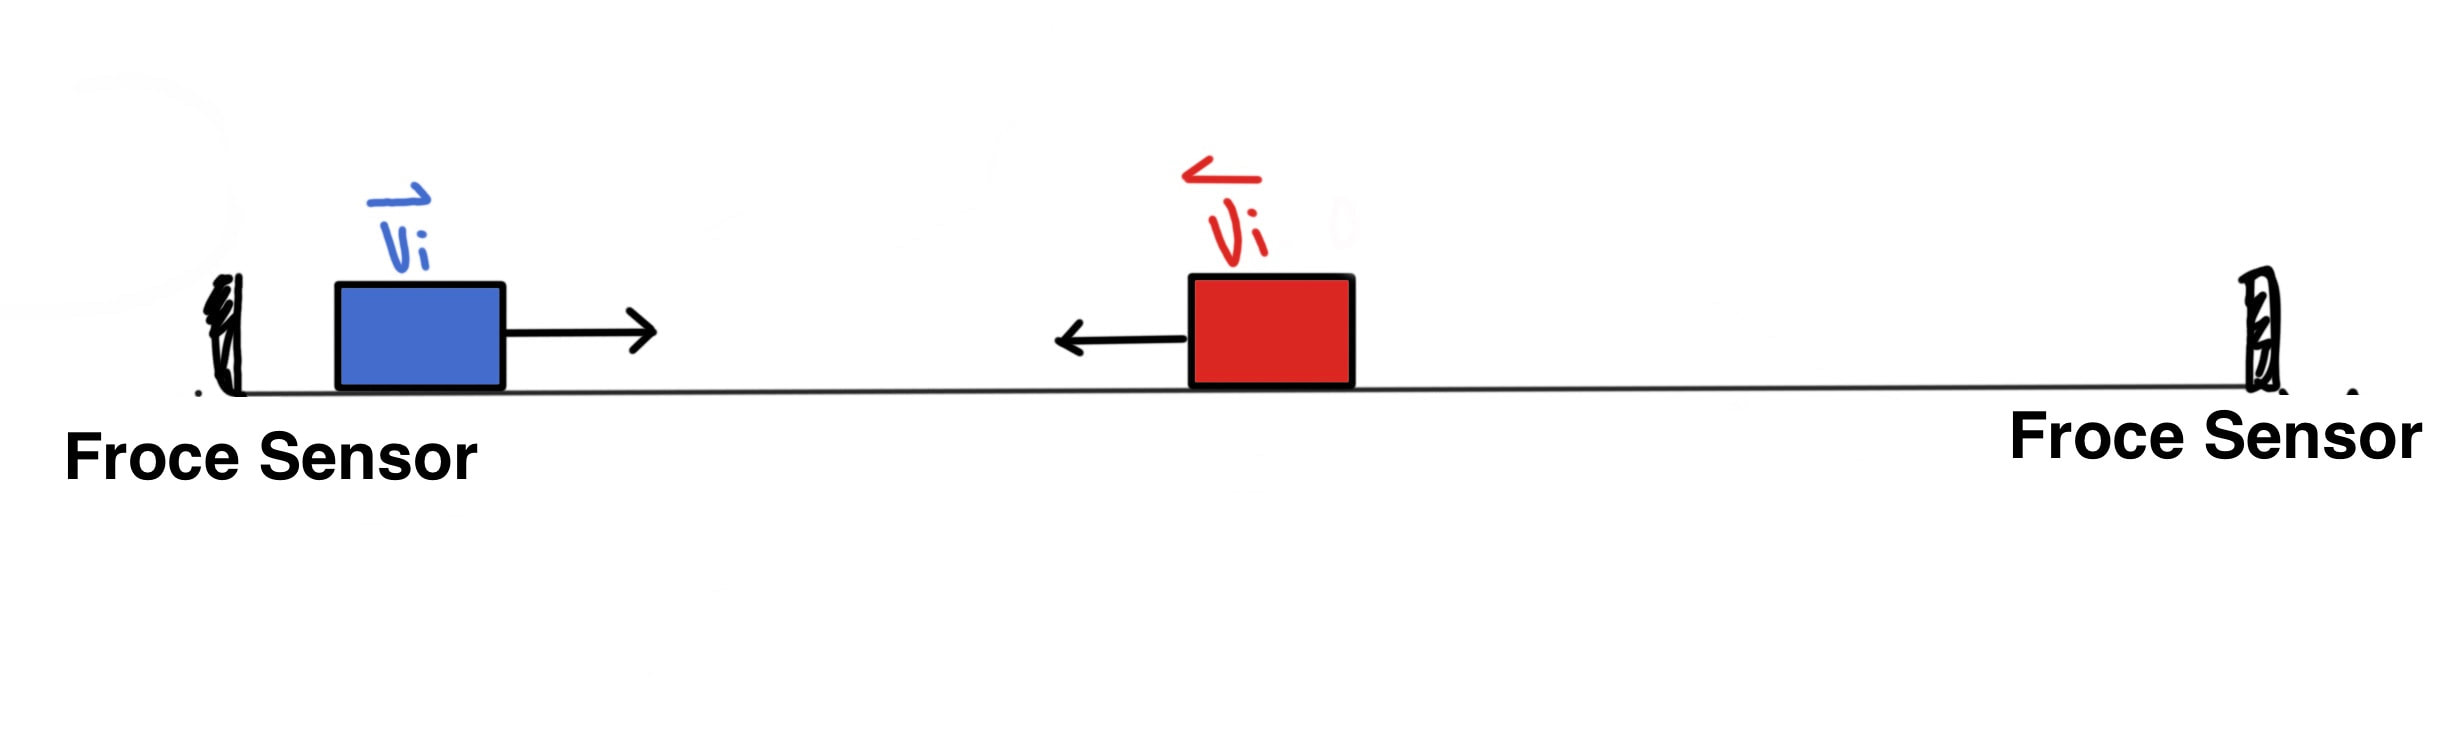
Push both carts away from the force sensor on the other side of the track. Let both the carts hit each other. Record data on Vernier Graphical Analysis.
- Impulse in the change in momentum
- J = ∆p = pf - pi=mf • vf - mi • vi
- Impulse is the area under Force V.S. Time graph
- J = F average • ∆t
Lab Set Up
Push both carts away from the force sensor on the other side of the track. Let both the carts hit each other. Record data on Vernier Graphical Analysis.
Momentum Bar Charts
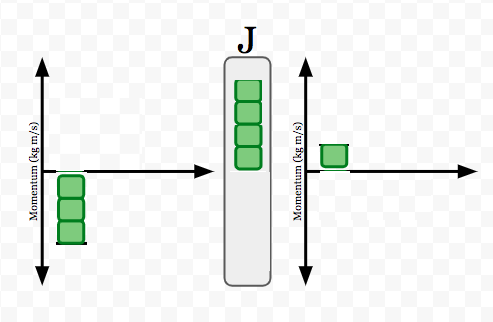
Momentum Bar Chart for Red Cart.
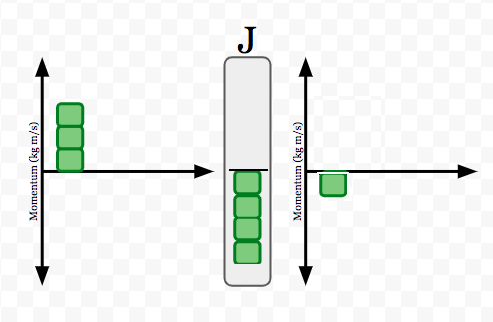
Momentum Bar Chart for Blue Cart.
Description of the Lab
According to the motion of the chart, we can say that the red cart initially has a momentum in the negative direction. When it hits the blue cart, the blue cart adds a positive impulse on the red cart, which results in its change in direction. Thus, after the red cart hits the blue cart, it has a smaller momentum in the positive direction since it is moving in the positive direction with a slower speed. The blue cart initially has a momentum in the positive direction. When it hits the red cart, the red cart adds a negative impulse on the blue cart, which results in its change in direction. Thus, after the blue cart hits the red cart, it has a smaller momentum in the negative direction since it is moving in the negative direction with a slower speed. Therefore, the change in momentum of both carts during the experiment can be described using the momentum bar chart showing above.
According to the motion of the chart, we can say that the red cart initially has a momentum in the negative direction. When it hits the blue cart, the blue cart adds a positive impulse on the red cart, which results in its change in direction. Thus, after the red cart hits the blue cart, it has a smaller momentum in the positive direction since it is moving in the positive direction with a slower speed. The blue cart initially has a momentum in the positive direction. When it hits the red cart, the red cart adds a negative impulse on the blue cart, which results in its change in direction. Thus, after the blue cart hits the red cart, it has a smaller momentum in the negative direction since it is moving in the negative direction with a slower speed. Therefore, the change in momentum of both carts during the experiment can be described using the momentum bar chart showing above.
- Conservation of Momentum equation with variables modeling the collision --> p initial + J = p final
Data Collection
MASS(m) of the cart = 389g = 0.389 kg
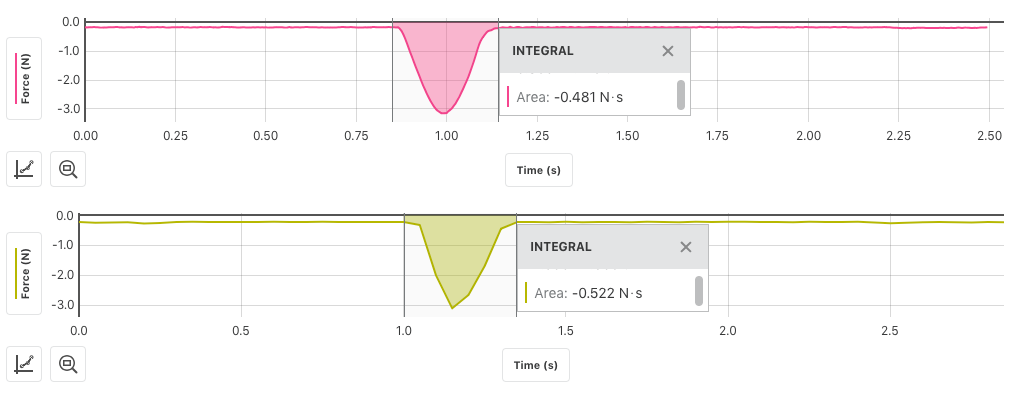
Graphs (by Force sensors on Vernier Graphical Analysis)
MASS(m) of the cart = 389g = 0.389 kg
Graphs (by Force sensors on Vernier Graphical Analysis)
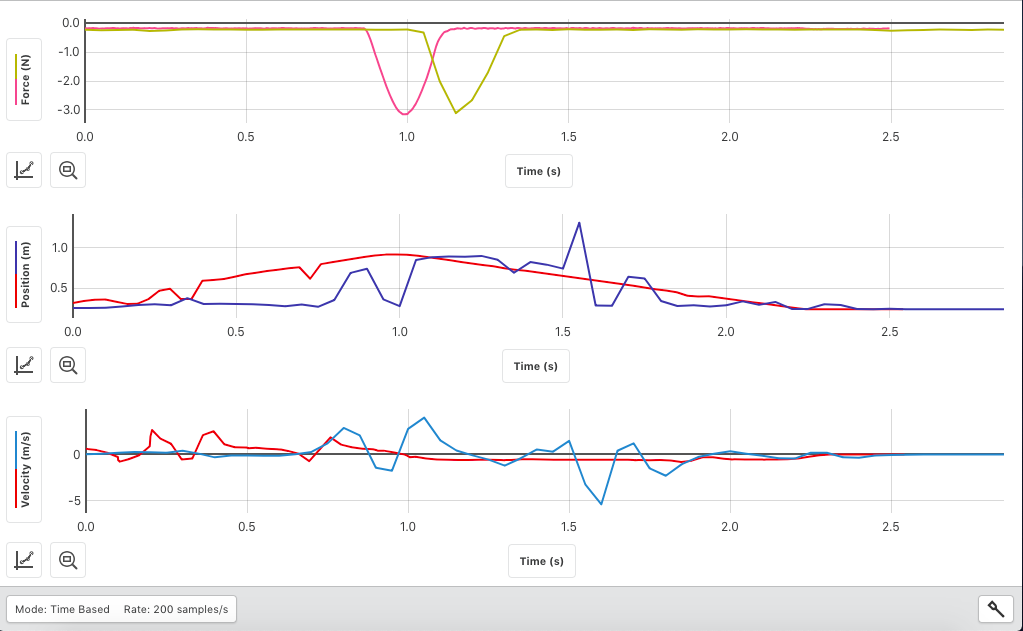
Yellow and Blue Line: Blue Cart
Red Line: Red Cart
(In each of the force sensor's perspective, both carts move in the positive direction)
Calculations
There are two ways that we can calculate the impulse
There are two ways that we can calculate the impulse
- Find the area between the curve and x-axis of the Force V.S Time graph
- Calculate the change in momentum by using Conservation of Momentum equation that models the collision.
The first way to figure out impulse is to find the area under the Force V.S Time graph
- We can do this by integrating the Force V.S Time graph on Vernier Graphical Analysis.
- Red Cart Impulse = -0.481
- Blue Cart Impulse= -0.522
With the second method, we can first estimate the initial and final velocity by looking at Velocity V.S. Time (estimate slope) graph or Position V.S. Time graph (approximate y-values).
According to the estimation,
Red Cart Vi ≈ 0.55 m/s
Red Cart Vf ≈ -0.567 m/s
According to the estimation,
Blue Cart Vi ≈ 0.716 m/s
Blue Cart Vf ≈ -0.441 m/s
Red Cart % Difference =| -0.481- (- 0.2859) | / |- 0.2859| = 68.24%
Blue Cart % Difference =| -0.522- (- 0.3625) | / |- 0.2962| = 44.00%
According to the estimation,
Red Cart Vi ≈ 0.55 m/s
Red Cart Vf ≈ -0.567 m/s
- pi + J = pf
- J = pf - pi
- Next, we can do the calculations to figure out the Red Cart's pi and pf using the equation p = MV
- pi = MVi = 0.256 kg * 0.55 m/s = 0.1408 kg*m/s
- pf = MVf = 0.256 kg * -0.567 m/s = - 0.1452 kg*m/s
- J = - 0.1452 - 0.1408 = - 0.2859 kg*m/s
According to the estimation,
Blue Cart Vi ≈ 0.716 m/s
Blue Cart Vf ≈ -0.441 m/s
- pi + J = pf
- J = pf - pi
- Next, we can do the calculations to figure out the Blue Cart's pi and pf using the equation p = MV
- pi = MVi = 0.256 kg * 0.716 m/s = 0.1833 kg*m/s
- pf = MVf = 0.256 kg * -0.67 m/s = - 0.1792 kg*m/s
- J = - 0.1792 - 0.1833 = - 0.3625 kg*m/s
Red Cart % Difference =| -0.481- (- 0.2859) | / |- 0.2859| = 68.24%
Blue Cart % Difference =| -0.522- (- 0.3625) | / |- 0.2962| = 44.00%
Conclusion
Due to the fact that there were some problems with our force sensor, we were not able to detect the most accurate velocity of both carts. Therefore, the change in momentum (∆p) is not as same as the area under Force V.S Time graph (F average • ∆t) since there are relatively big percent differences of 68.24% for red carts and a 44.00% for blue carts. However, according to our book, the concepts of Impulse and Momentum still stands.
Due to the fact that there were some problems with our force sensor, we were not able to detect the most accurate velocity of both carts. Therefore, the change in momentum (∆p) is not as same as the area under Force V.S Time graph (F average • ∆t) since there are relatively big percent differences of 68.24% for red carts and a 44.00% for blue carts. However, according to our book, the concepts of Impulse and Momentum still stands.
Uncertainties...
- Friction. In this lab, we have ignored friction between the cart and the track. This may have affected our graphs.
- Slope Estimation. Since we used Logger Pro to estimate the slope to figure out the velocity, it is not very accurate.
- Technique problems. Since there were problems with our force sensor, we were not able to collect the most accurate data for our lab.
Widget is loading comments...
