In this lab, we are trying to verify the validity of the concepts of Momentum that we have discussed in this unit:
- Momentum is a conserved quantity, like energy
- In this lab, there are no external forces acting on our systems, which means Impulse (J) = 0 kg*m/s
- Therefore, our ultimate goal in each scenario is to prove pi = pf
- p=mv
- J=∆p=pf-pi=mf • vf - mi • vi
- pi+J=pf
- Momentum can be modeled using bar charts
- Bouncy Collision (one moving, one stationary)
- Bouncy Collision (both moving)
- Sticky Collision (one moving, one stationary)
- sticky collision (both moving)
- Explosion (Neither is moving, then both are moving)
Scenario 1 - Bouncy Collision (one moving, one stationary)
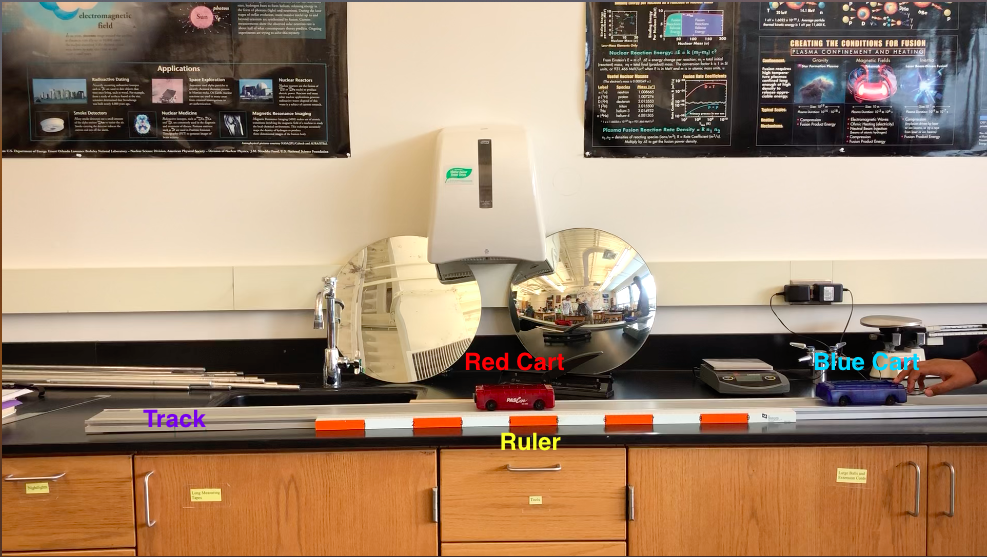
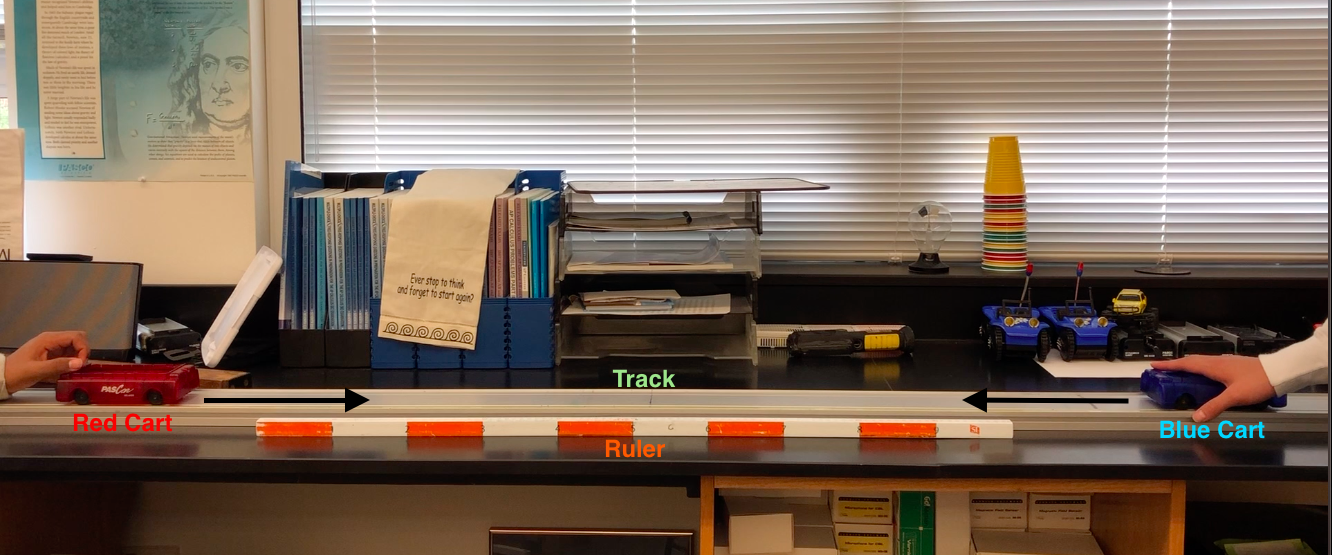
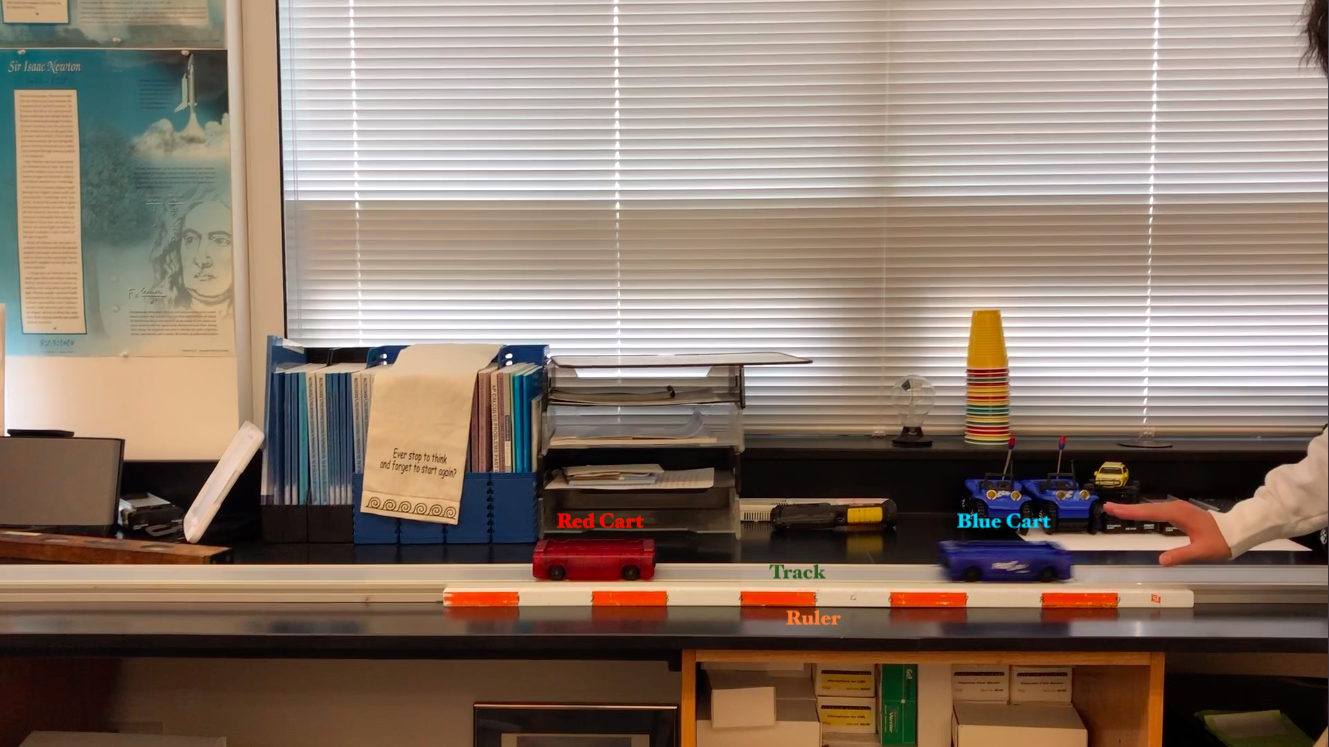
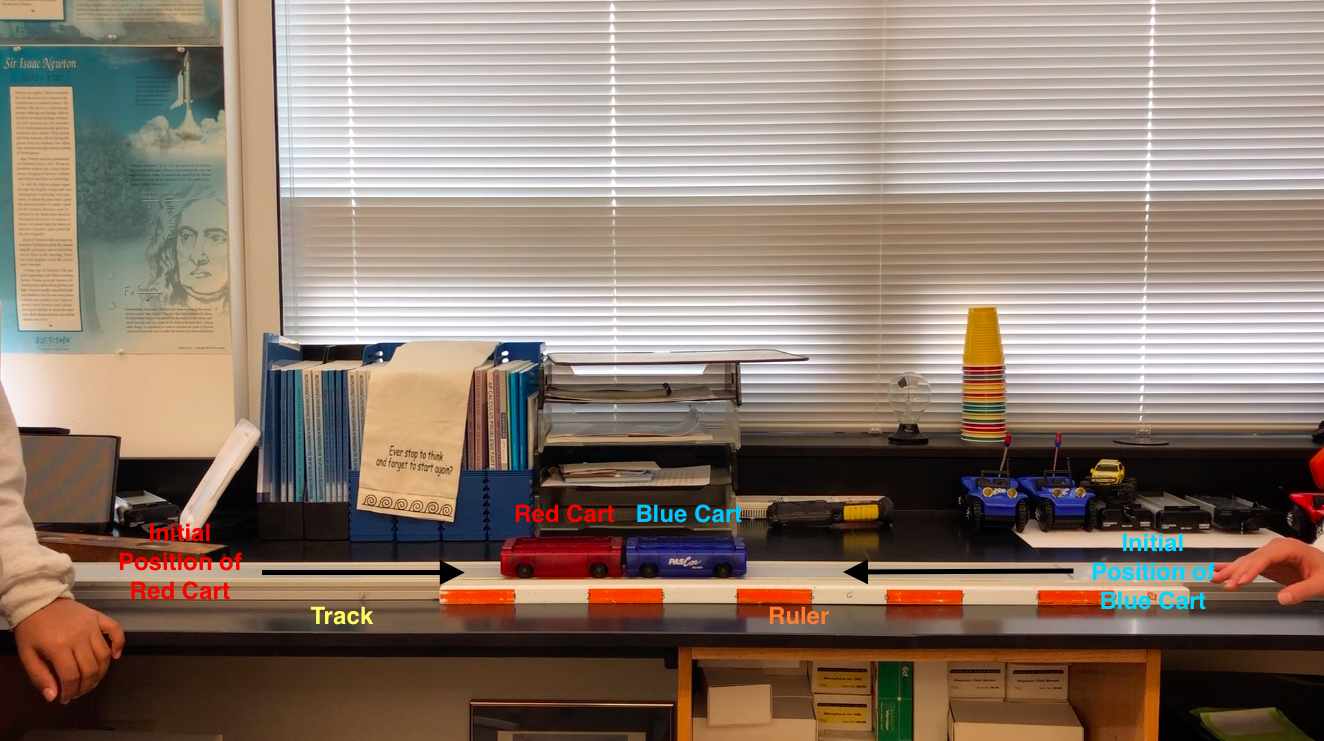
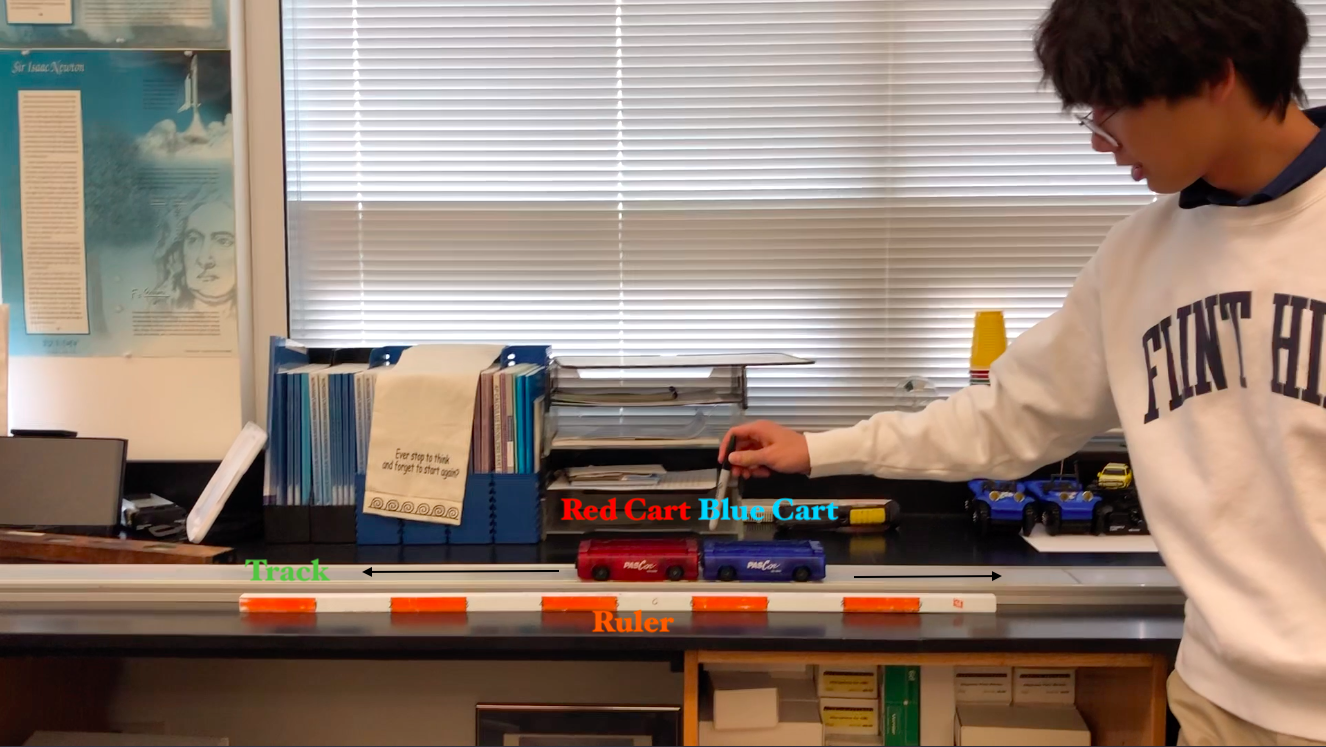
Set-up
The blue car moves towards the red car (stationary). The blue car hits the red car, and they bounces off each other.
Set-up
The blue car moves towards the red car (stationary). The blue car hits the red car, and they bounces off each other.
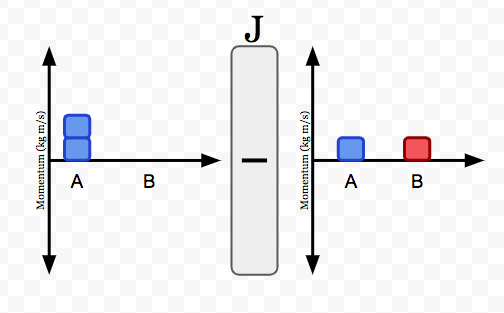
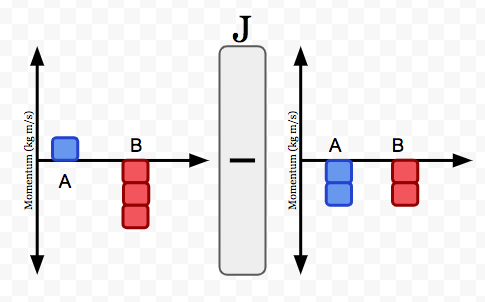
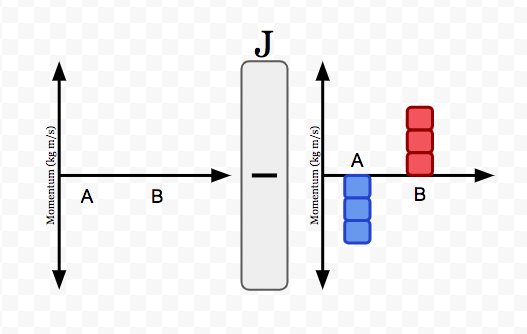
Momentum Bar Chart
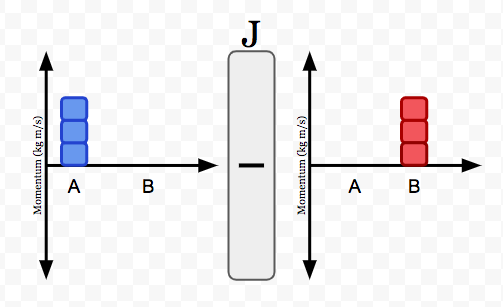
Since it is going in a negative direction, the blocks should be in the negative direction.
Lab Description:
The blue cart (A) starts moving with a momentum in the negative direction, while the red cart (B)rests on the track, which means no momentum at this time. The blue car hits the red car and the red car also starts to move in a negative direction with a momentum in the negative direction. The blue car stops moving after the collision.
*Since there is no external impulse is added to the carts-track system, therefore
J = 0 kg*m/s.
Raw Data
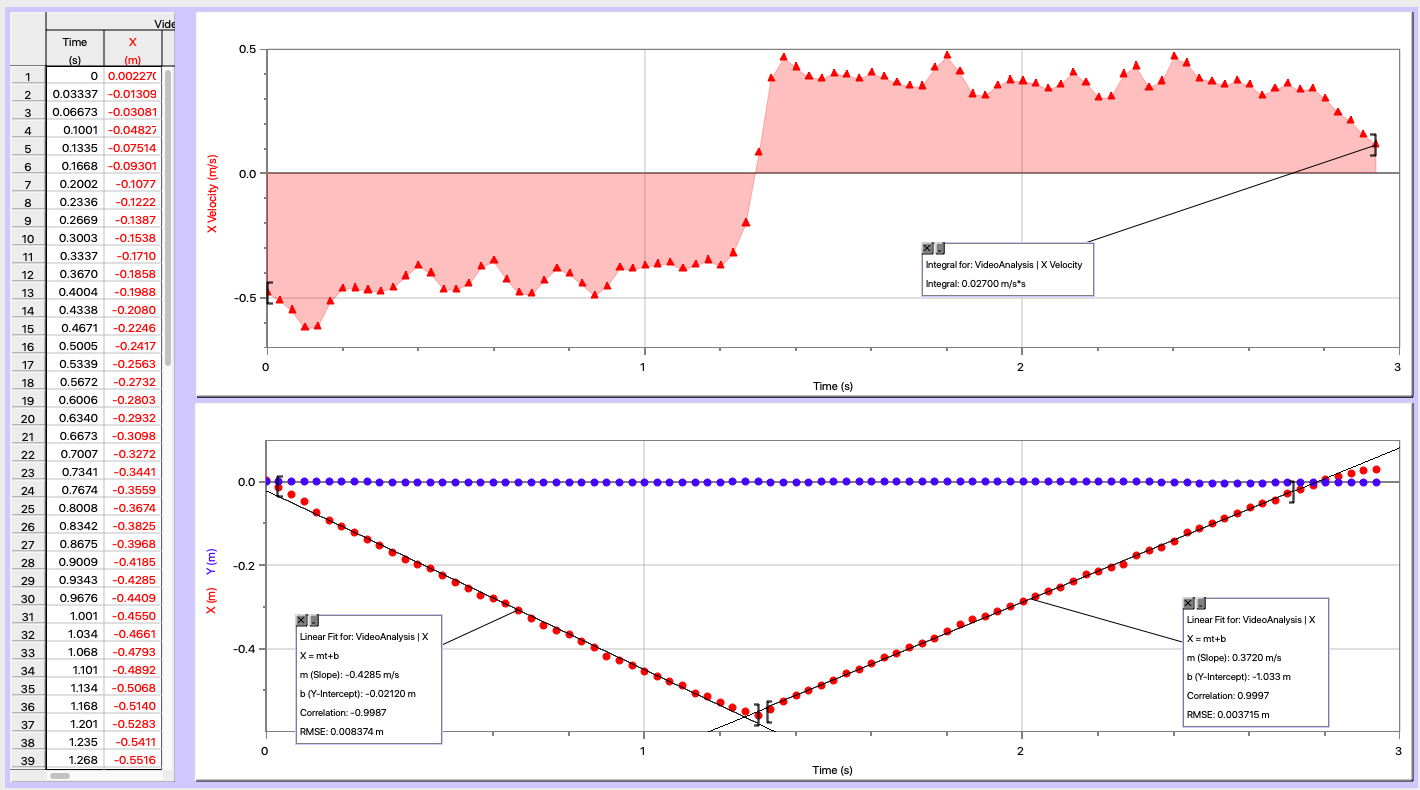
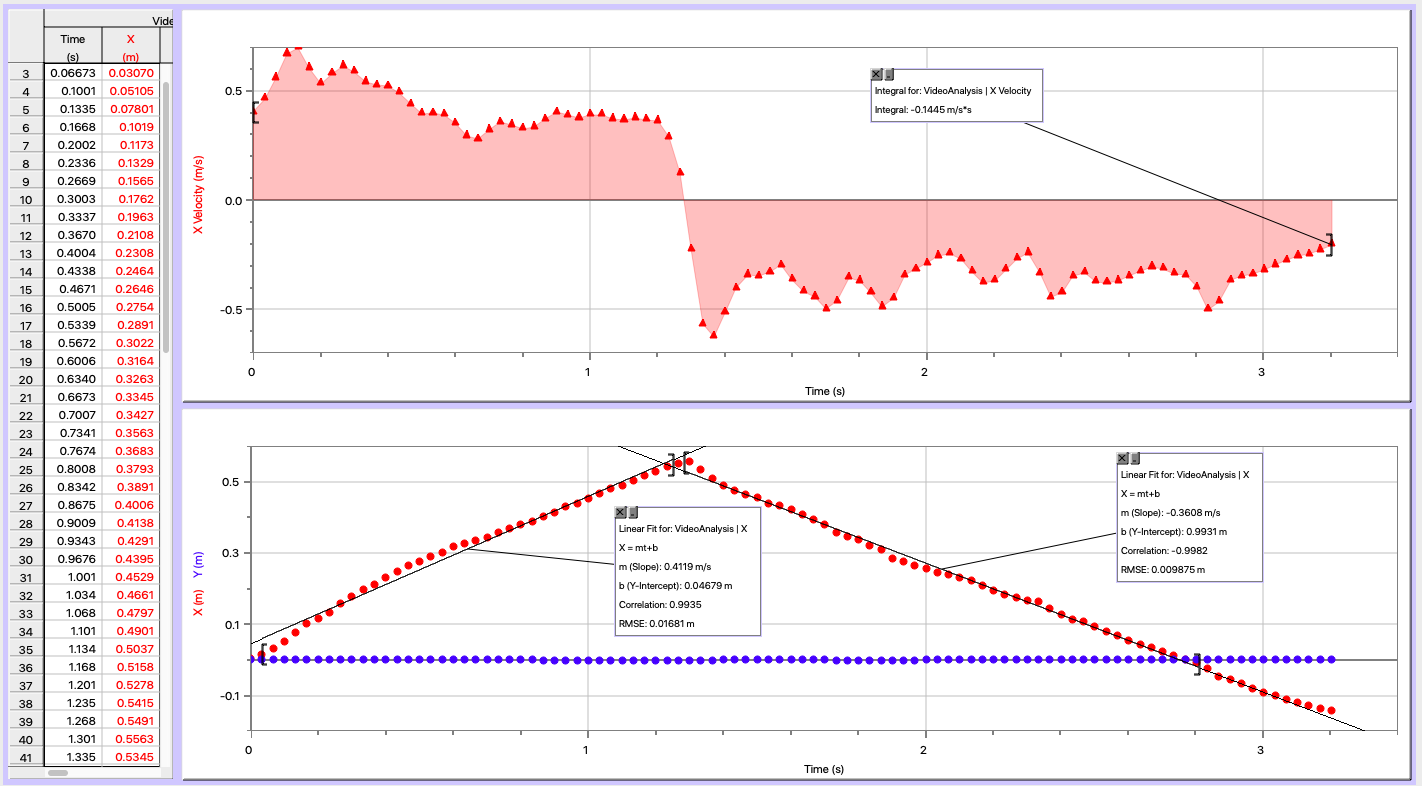
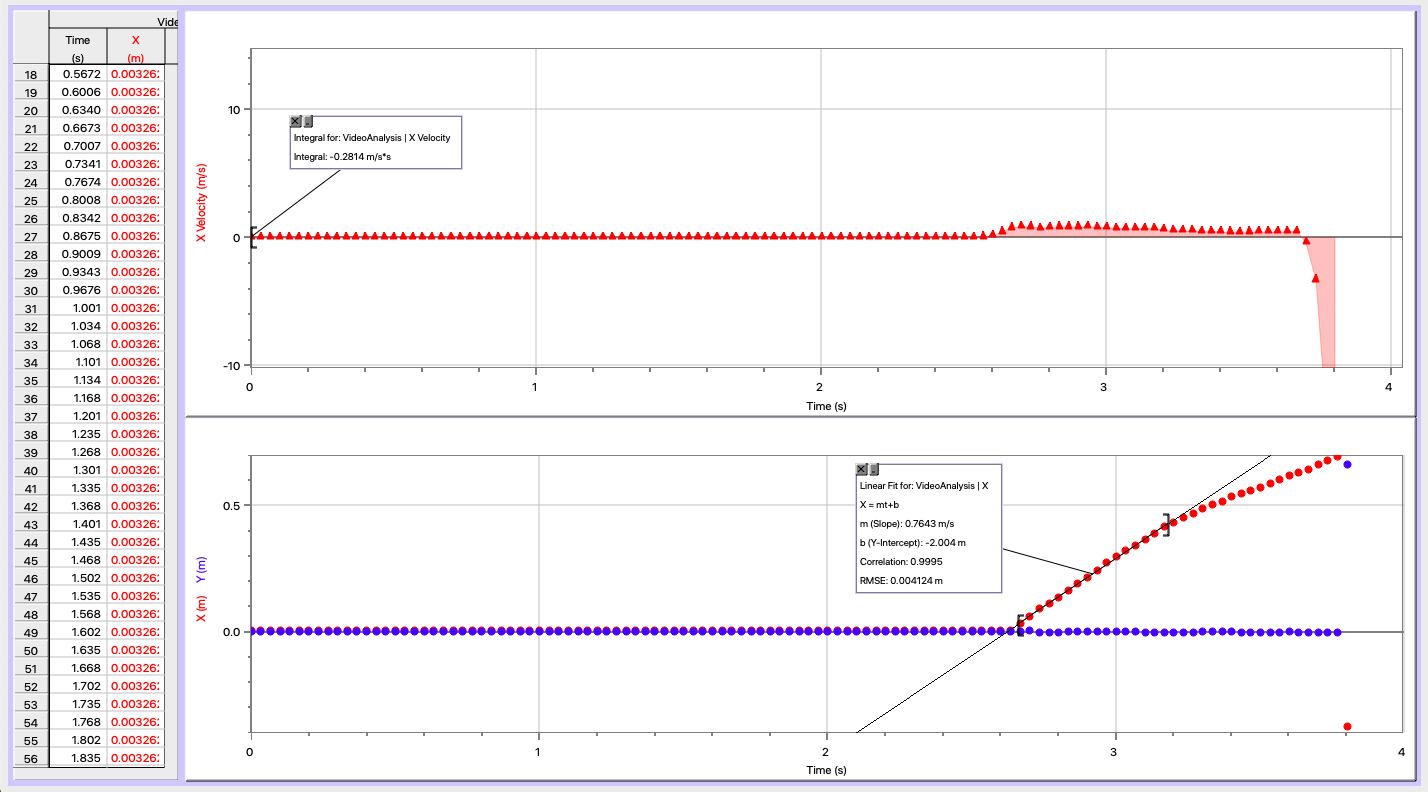
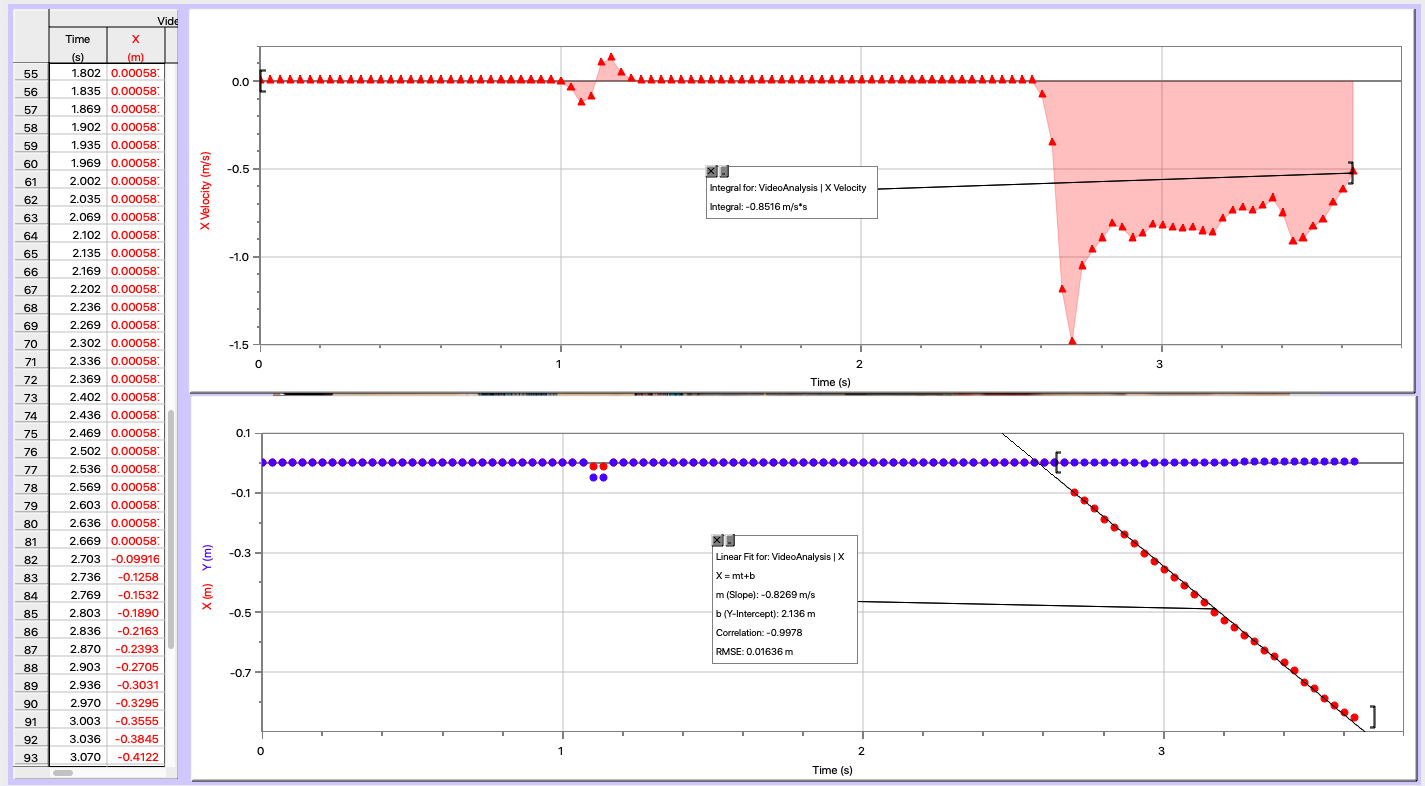
The following are the graphs created on Logger Pro using video analysis. Since video analysis can only analyze one cart's motion at a time, the first graph will display the position and velocity of the blue cart and the second graph will display the position and velocity of the red cart.
The following are the graphs created on Logger Pro using video analysis. Since video analysis can only analyze one cart's motion at a time, the first graph will display the position and velocity of the blue cart and the second graph will display the position and velocity of the red cart.
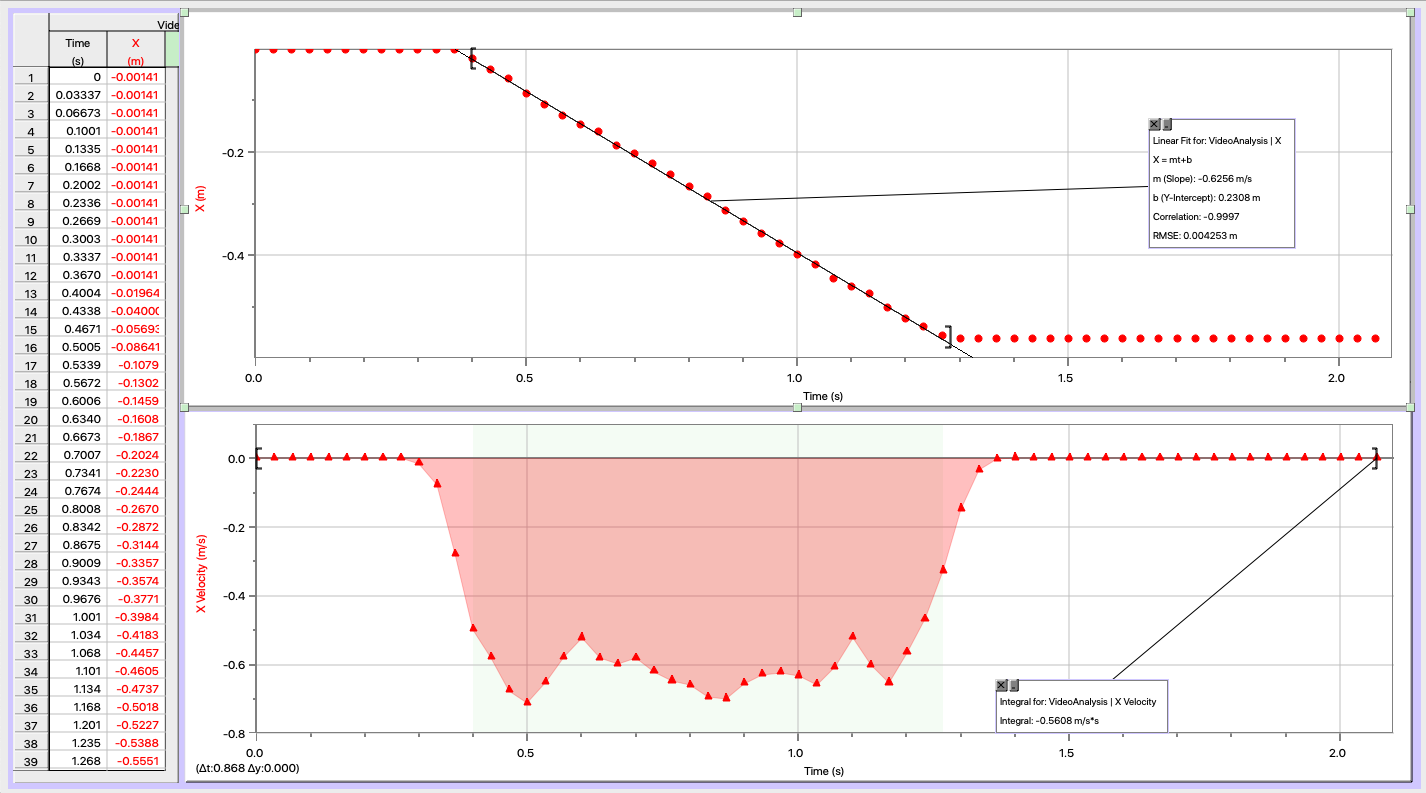
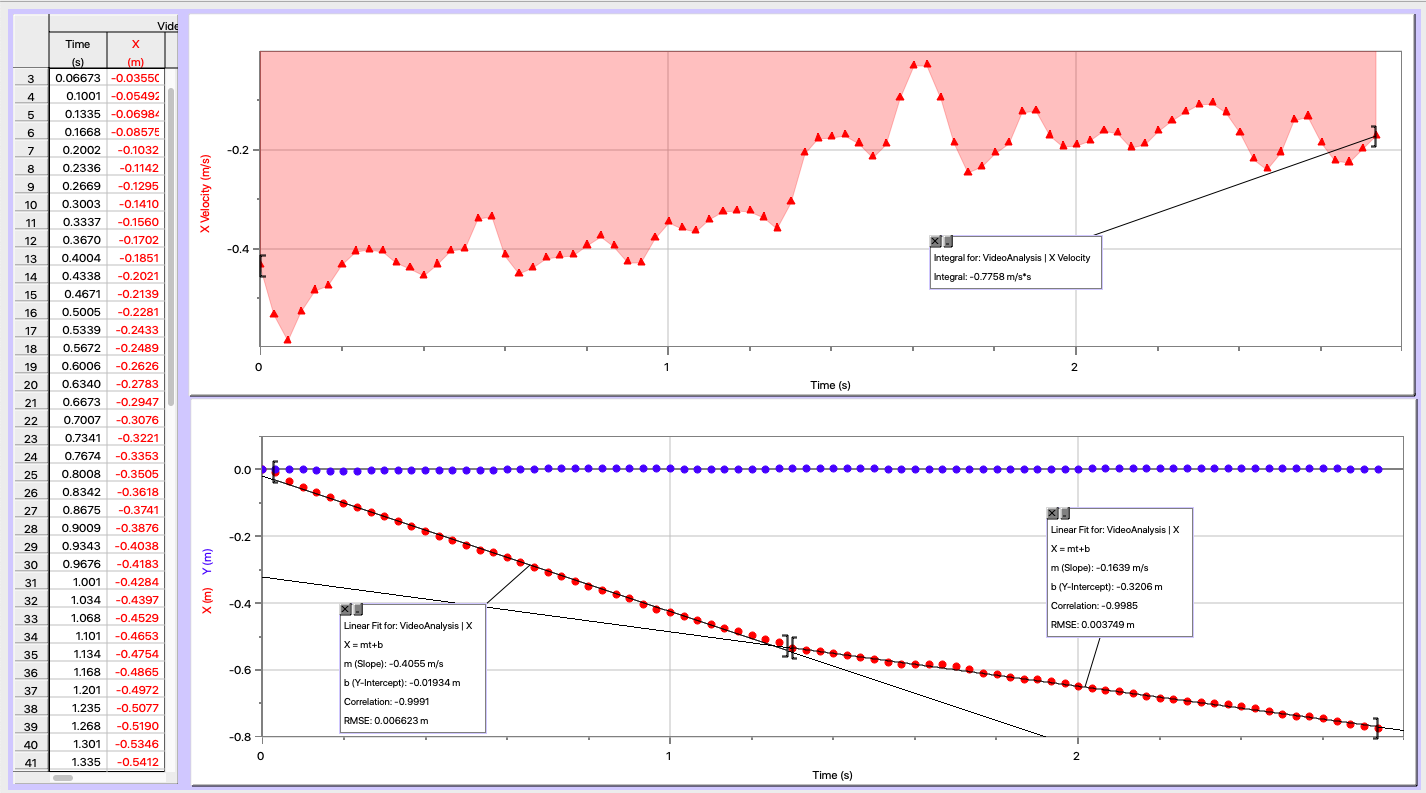
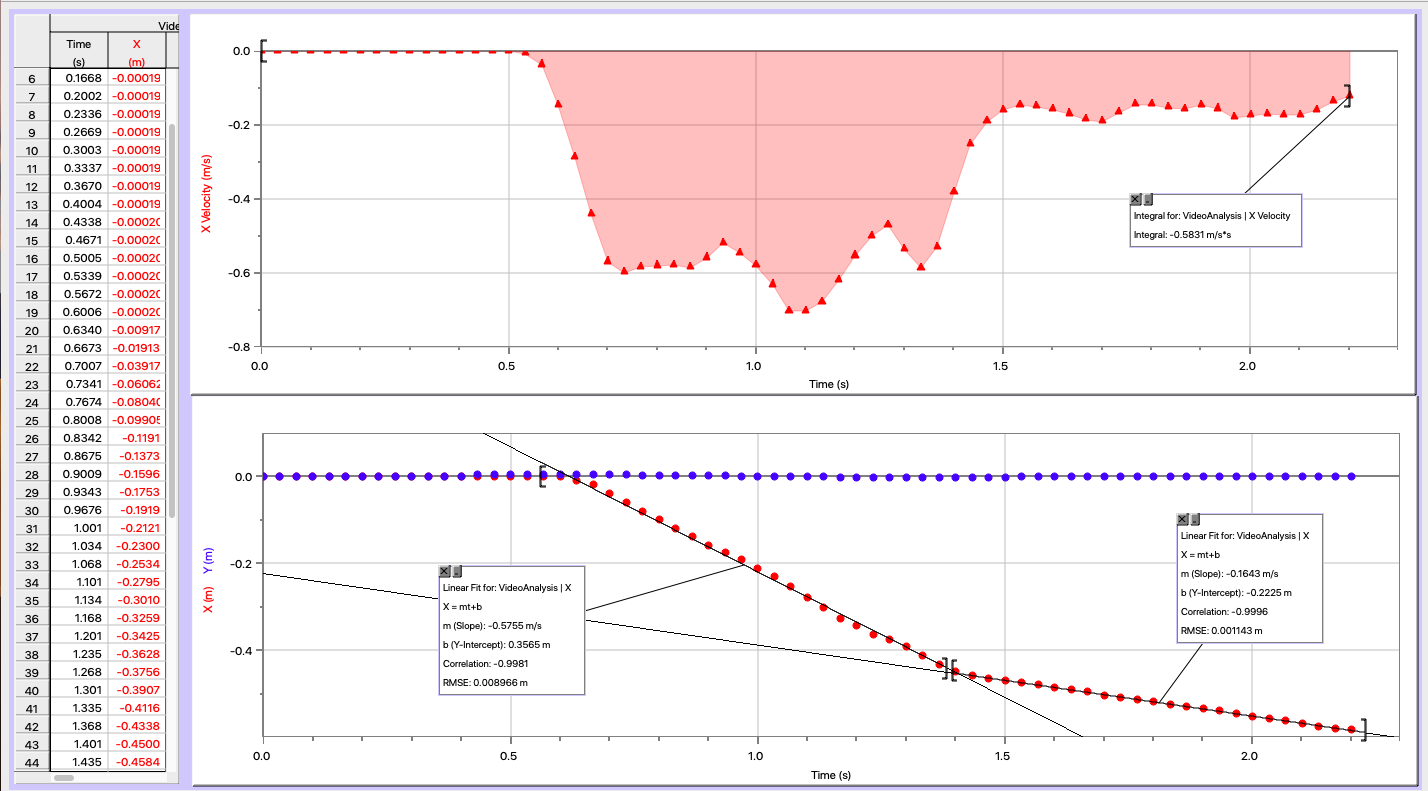
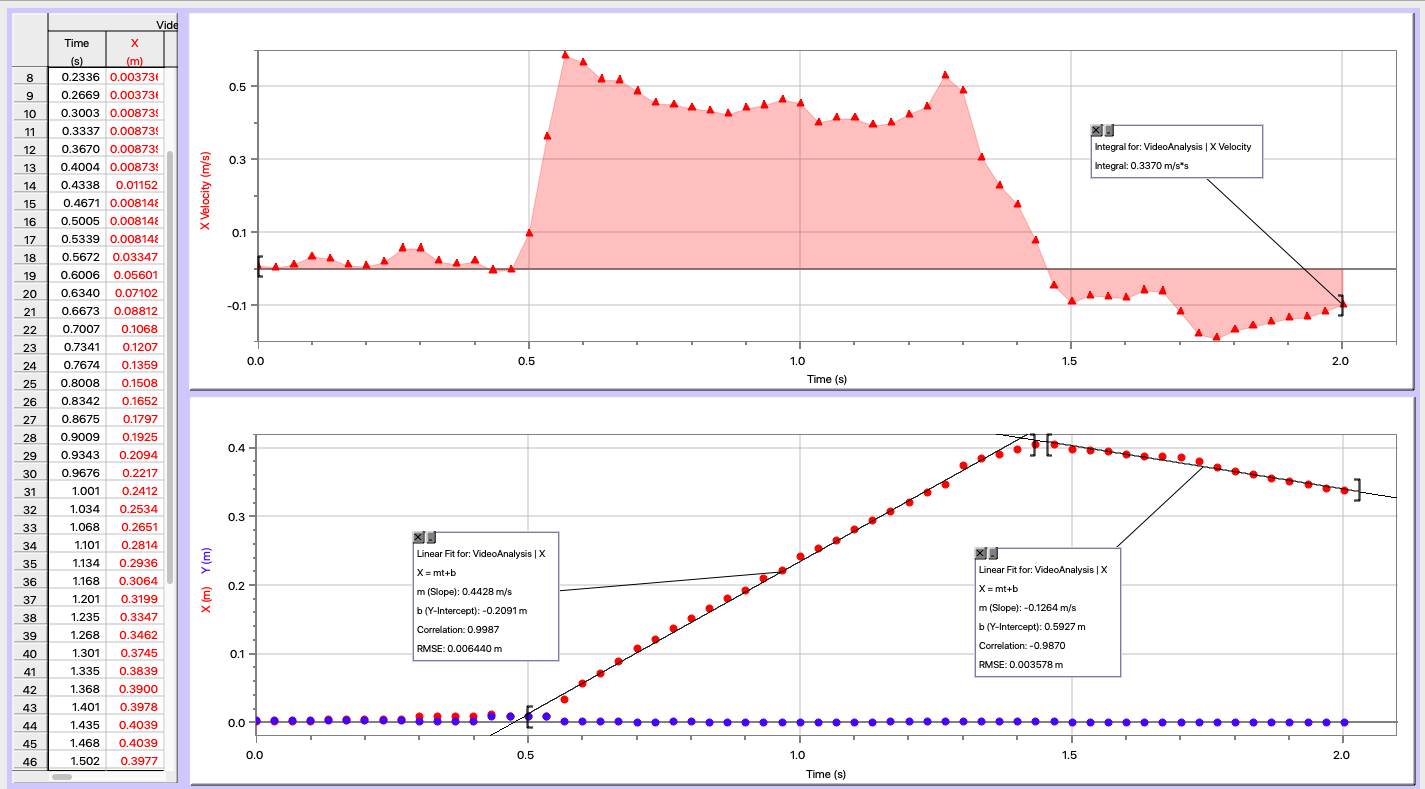
Raw Data Graph for the Blue Cart (The top one is the position-time graph. The bottom one is the velocity-time graph)
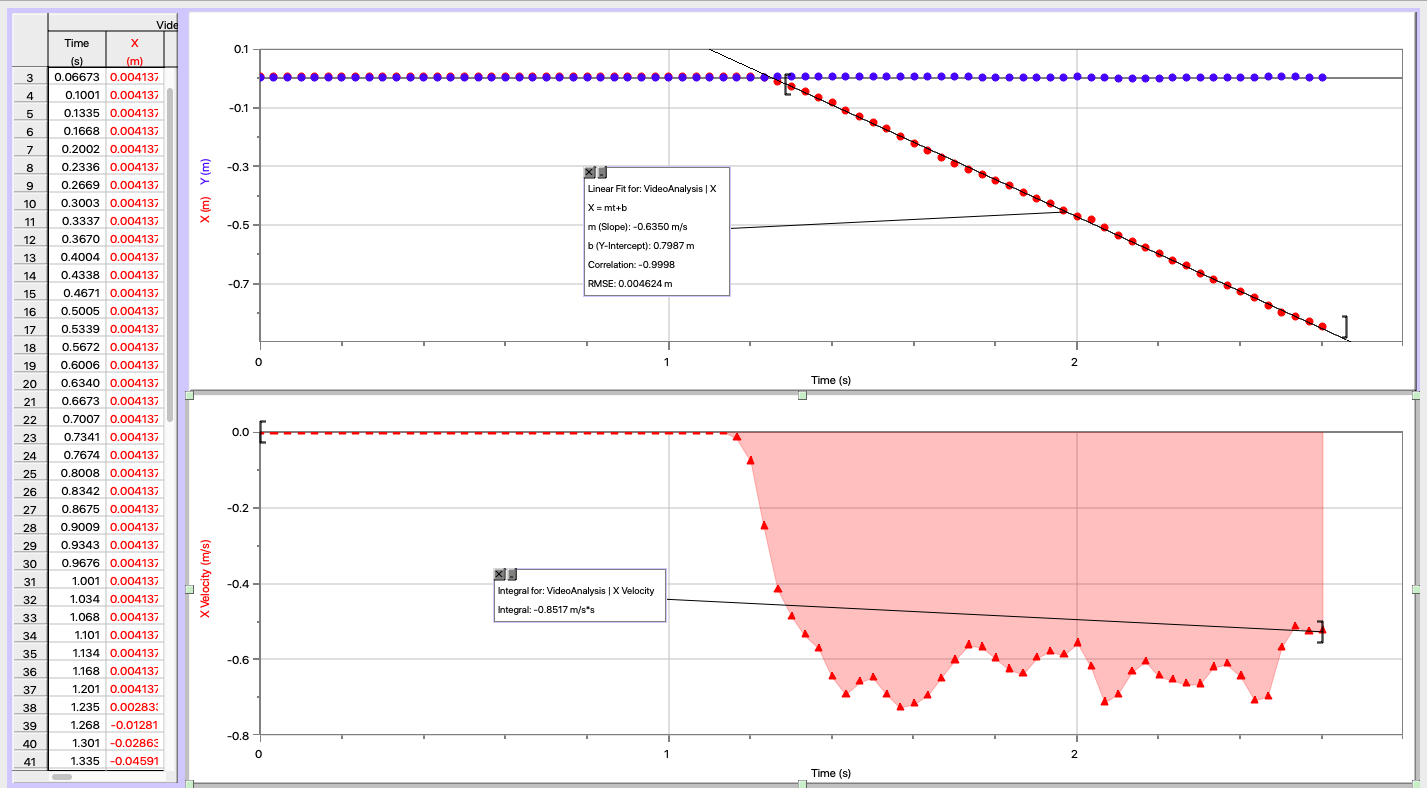
Raw Data Graph for the Red Cart. (The top one is the position-time graph, the bottom one is the velocity-time graph)
Processed Data
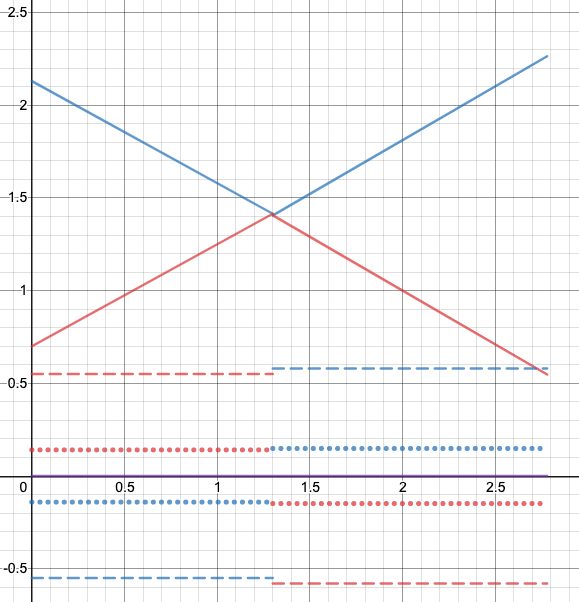
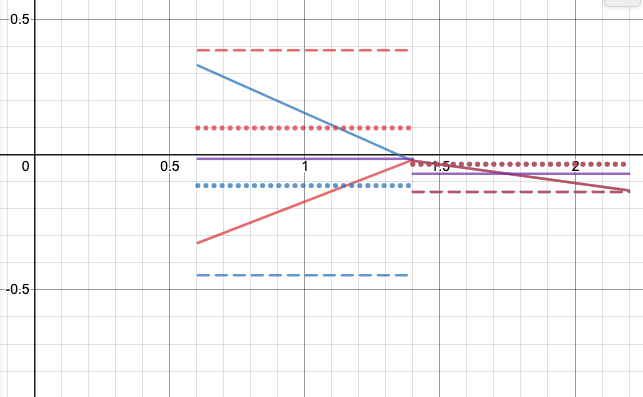
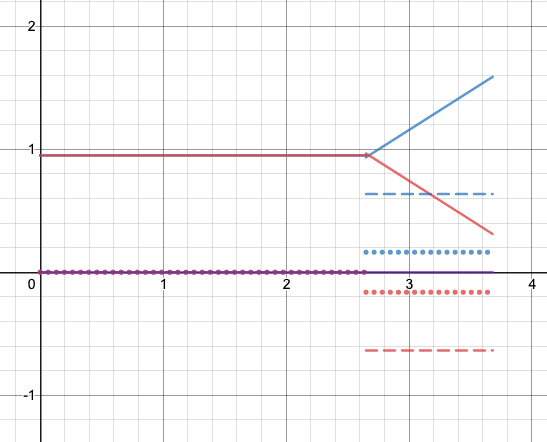
Next, we reorganize and consolidate the two graphs into one combined graph using Desmos.
blue solid line --> position of Cart A. red solid line --> position of Cart B
blue dashed line --> velocity of Cart A. red dashed line --> velocity of Cart B
blue dotted line --> momentum of Cart A. red dotted line --> momentum of Cart B
purple solid line --> momentum of the system
Calculations
Final Momentum = Mass * Vf = 0.256 kg * -0.6350 m/s = 0.15875 kg*m/s
% Difference = |0.1684 - 0.15875| / 0.1684 = 5.73%
- pi(a) = pf(b)
- MVi(a) = MVf(b)
Final Momentum = Mass * Vf = 0.256 kg * -0.6350 m/s = 0.15875 kg*m/s
% Difference = |0.1684 - 0.15875| / 0.1684 = 5.73%
Conclusion
What we are trying to prove is that the momentum will always be conserved when there is no external force applied. If momentum is conserved throughout, the total momentum of the system should be the same before and after the collision. In Scenario 1, based on the graphs and calculation, the initial momentum that Blue Cart started with is -0.1684 kg*m/s. After the collision, Cart A stops moving and Red Cart starts to move with a momentum of 0.15875 kg*m/s. We get a percent difference of 5.73%, which is relatively small. Therefore, we can conclude that momentum is proved to be conserved in Scenario 1. This concept can also be proved in the Desmos graph that we created. Since the graph of total momentum is a straight line throughout the entire process of the lab, this indicates that the amount of momentum does not change, which means the momentum is conserved.
What we are trying to prove is that the momentum will always be conserved when there is no external force applied. If momentum is conserved throughout, the total momentum of the system should be the same before and after the collision. In Scenario 1, based on the graphs and calculation, the initial momentum that Blue Cart started with is -0.1684 kg*m/s. After the collision, Cart A stops moving and Red Cart starts to move with a momentum of 0.15875 kg*m/s. We get a percent difference of 5.73%, which is relatively small. Therefore, we can conclude that momentum is proved to be conserved in Scenario 1. This concept can also be proved in the Desmos graph that we created. Since the graph of total momentum is a straight line throughout the entire process of the lab, this indicates that the amount of momentum does not change, which means the momentum is conserved.
Scenario 2 - Bouncy Collision (both moving)
Set-up
The blue car moves towards the red car while the red car moves to the blue car in the mean time . The hit each other, and they bounces off each other.
Set-up
The blue car moves towards the red car while the red car moves to the blue car in the mean time . The hit each other, and they bounces off each other.
Momentum Bar Chart
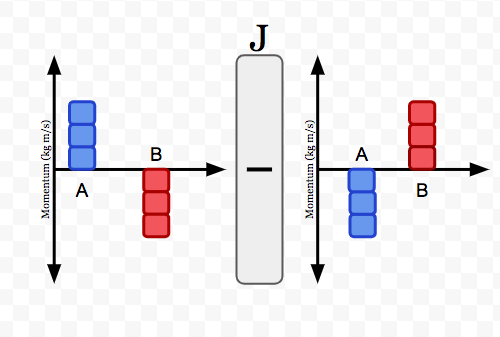
The blue blocks indicate red cart while the red blocks indicate blue cart.
Lab Description:
The blue cart (B) starts moving with a momentum in the negative direction, while the red cart (A) is moving in a positive direction. They both move until they hit each other and bounces back to the direction where they started.
*Since there is no external impulse is added to the carts-track system, therefore
J = 0 kg*m/s.
Raw Data
The following are the graphs created on Logger Pro using video analysis. Since video analysis can only analyze one cart's motion at a time, the first graph will display the position and velocity of the blue cart and the second graph will display the position and velocity of the red cart.
The following are the graphs created on Logger Pro using video analysis. Since video analysis can only analyze one cart's motion at a time, the first graph will display the position and velocity of the blue cart and the second graph will display the position and velocity of the red cart.
Raw Data Graph for the Blue Cart (The top one is the velocity-time graph. The bottom one is the position-time graph)
Raw Data Graph for the Blue Cart (The top one is the velocity-time graph. The bottom one is the position-time graph)
Processed Data
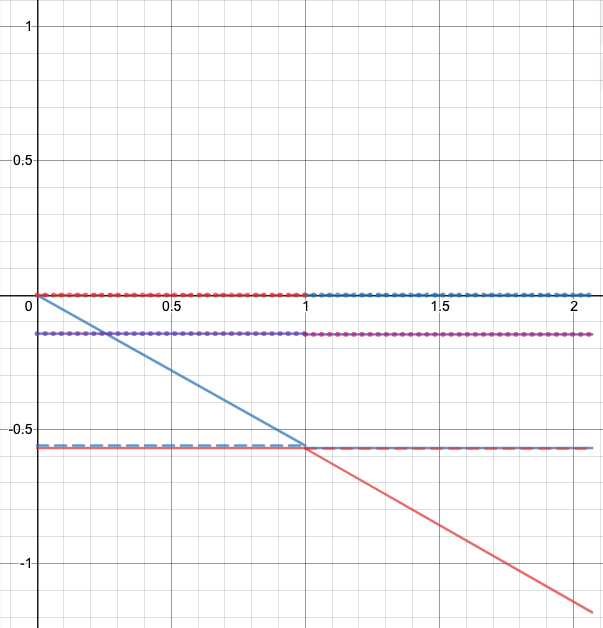
Next, we reorganize and consolidate the two graphs into one combined graph using Desmos.
blue solid line --> position of Cart B. red solid line --> position of Cart A
blue dashed line --> velocity of Cart B. red dashed line --> velocity of Cart A
blue dotted line --> momentum of Cart B. red dotted line --> momentum of Cart A
purple solid line --> momentum of the system
Calculations
-0.0016787kg*m/s
Final Momentum = Mass(a) * Vf(a) + Mass(b) * Vf(b)= 0.256 kg * (-0.4285) m/s + 0.256 kg * (0.3720) m/s= 0.0006352kg*m/s
% Difference = |-0.0016787 - (0.0006352| / -0.0016787= -13.78 %
- pi(a) +pi(b) = pf(a) + pf(b)
- MVi(a) +MVi(b) = MVf(a) + MVf(b)
-0.0016787kg*m/s
Final Momentum = Mass(a) * Vf(a) + Mass(b) * Vf(b)= 0.256 kg * (-0.4285) m/s + 0.256 kg * (0.3720) m/s= 0.0006352kg*m/s
% Difference = |-0.0016787 - (0.0006352| / -0.0016787= -13.78 %
Conclusion
What we are trying to prove is that the momentum will always be conserved when there is no external force applied. If momentum is conserved throughout, the total momentum of the system should be the same before and after the collision. In Scenario 2, based on the graphs and calculation, the initial momentum of the system is (Cart A + Cart B)-0.0016787 kg*m/s. After the collision, total momentum of the system is 0.0006352 kg*m/s. We get a percent difference of -13.78.0%, which is relatively small. Therefore, we can conclude that momentum is proved to be conserved in Scenario 2. This concept is also proved in the Desmos graph that we created. Since the graph of total momentum (purple solid line) is a straight line throughout the entire process of the lab, this indicates that the amount of momentum does not change and therefore proves again that momentum is conserved.
What we are trying to prove is that the momentum will always be conserved when there is no external force applied. If momentum is conserved throughout, the total momentum of the system should be the same before and after the collision. In Scenario 2, based on the graphs and calculation, the initial momentum of the system is (Cart A + Cart B)-0.0016787 kg*m/s. After the collision, total momentum of the system is 0.0006352 kg*m/s. We get a percent difference of -13.78.0%, which is relatively small. Therefore, we can conclude that momentum is proved to be conserved in Scenario 2. This concept is also proved in the Desmos graph that we created. Since the graph of total momentum (purple solid line) is a straight line throughout the entire process of the lab, this indicates that the amount of momentum does not change and therefore proves again that momentum is conserved.
Scenario 3 - Sticky Collision (one moving, one stationary)
Set-up
The blue car moves towards the red car while the red stays rest. The blue cart hit the red cart and sticks to it. They both move in the negative direction.
Set-up
The blue car moves towards the red car while the red stays rest. The blue cart hit the red cart and sticks to it. They both move in the negative direction.
Momentum Bar Chart
All the blocks should be moving in the negative direction.
Lab Description:
The blue cart (A) starts off moving in the negative direction, while the red cart (B) is sitting still on the track with no momentum. The blue car hits the red car, the two carts will be attached together by the magnets in between. After the collision, both Carts start moving in the negative direction with a negative momentum.
*No external impulse is added to the carts-track system, therefore
J = 0 kg*m/s.
Raw Data
The following are the graphs created on Logger Pro using video analysis. Since video analysis can only analyze one cart's motion at a time, the first graph will display the position and velocity of the blue cart and the second graph will display the position and velocity of the red cart.
The following are the graphs created on Logger Pro using video analysis. Since video analysis can only analyze one cart's motion at a time, the first graph will display the position and velocity of the blue cart and the second graph will display the position and velocity of the red cart.
Raw Data Graph for the Blue Cart (The top one is the velocity-time graph. The bottom one is the position-time graph)
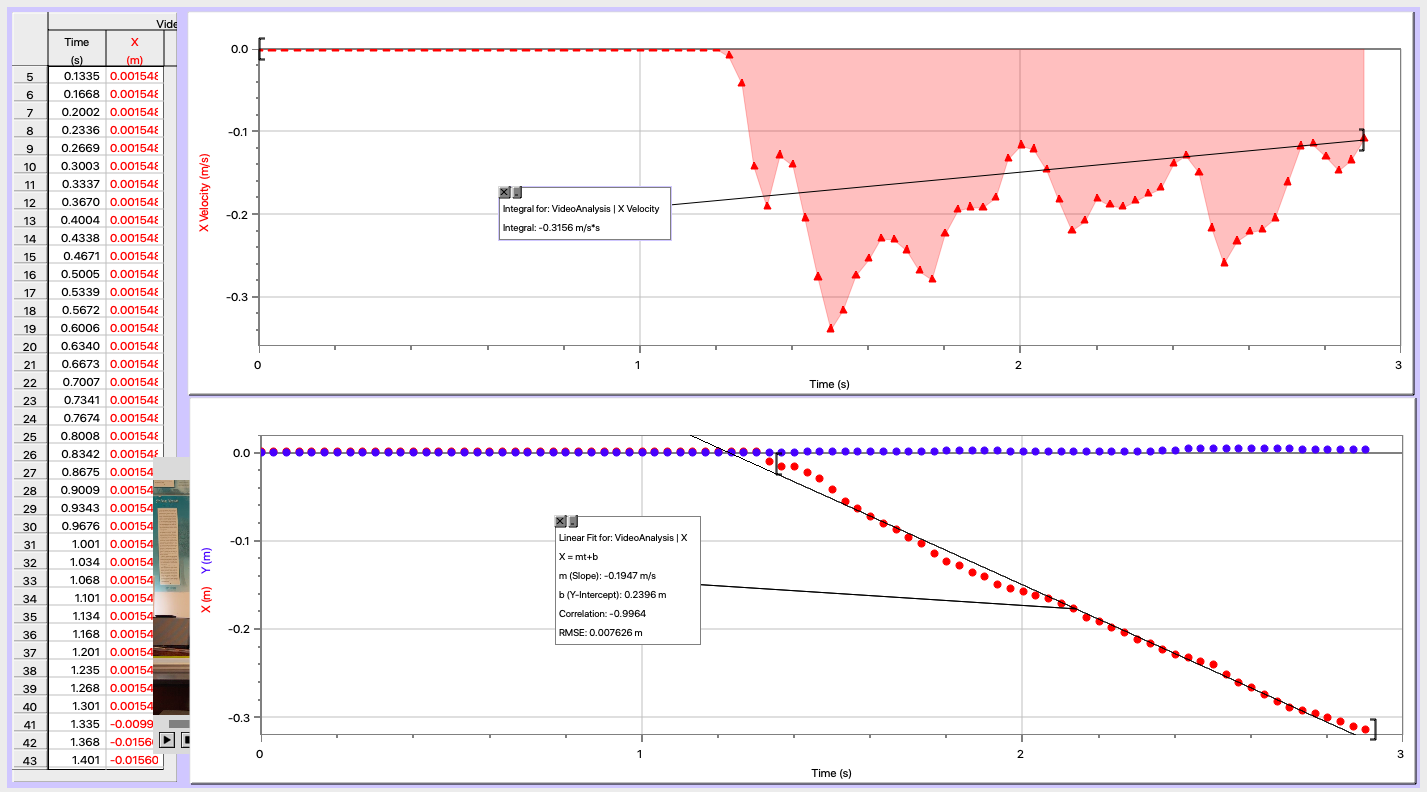
Raw Data Graph for the Red Cart (The top one is the velocity-time graph. The bottom one is the position-time graph)
Processed Data
Next, we reorganize and consolidate the two graphs into one combined graph using Desmos.
blue solid line --> position of Cart A. red solid line --> position of Cart B
blue dashed line --> velocity of Cart A. red dashed line --> velocity of Cart B
blue dotted line --> momentum of Cart A. red dotted line --> momentum of Cart B
purple solid line --> momentum of the system
Calculations
Final Momentum = Mass(a) * Vf(a) + Mass(b) * Vf(b)= 0.256 kg * -0.1947 m/s + 0.256 kg * -0.1639 m/s= -0.0918016 kg*m/s
% Difference = |-0.0918016 +0.103808| / -0.103808 = -11.56 %
- pi(b) = pf(a) + pf(b)
- MVi(b) = MVf(a) + MVf(b)
Final Momentum = Mass(a) * Vf(a) + Mass(b) * Vf(b)= 0.256 kg * -0.1947 m/s + 0.256 kg * -0.1639 m/s= -0.0918016 kg*m/s
% Difference = |-0.0918016 +0.103808| / -0.103808 = -11.56 %
Conclusion
What we are trying to prove is that the momentum will always be conserved when there is no external force applied. If momentum is conserved throughout, the total momentum of the system should be the same before and after the collision. In Scenario 3, based on the graphs and calculation, the initial momentum of the system is the initial momentum of Cart B, which is -0.103808 kg*m/s. After the collision, total momentum of the system is the sum of the momentum of Cart A and the momentum of Cart B, which is -0.0918016 kg*m/s according to our calculation. We yield a percent difference of 6.98%, which is pretty small. Therefore, we can conclude that momentum is proved to be conserved in Scenario 3. This concept is also proved in the Desmos graph that we created. Since the graph of total momentum (purple solid line) is a almost straight line throughout the entire process of the lab, this indicates that the amount of momentum does not change significantly and therefore proves again that momentum is conserved.
What we are trying to prove is that the momentum will always be conserved when there is no external force applied. If momentum is conserved throughout, the total momentum of the system should be the same before and after the collision. In Scenario 3, based on the graphs and calculation, the initial momentum of the system is the initial momentum of Cart B, which is -0.103808 kg*m/s. After the collision, total momentum of the system is the sum of the momentum of Cart A and the momentum of Cart B, which is -0.0918016 kg*m/s according to our calculation. We yield a percent difference of 6.98%, which is pretty small. Therefore, we can conclude that momentum is proved to be conserved in Scenario 3. This concept is also proved in the Desmos graph that we created. Since the graph of total momentum (purple solid line) is a almost straight line throughout the entire process of the lab, this indicates that the amount of momentum does not change significantly and therefore proves again that momentum is conserved.
Scenario 4 - Sticky Collision (both moving)
Set-up
The blue car moves towards the red car while the red cart also moves in the opposite direction. The hit each other and stick to each other. They move a little bit to the right after the collision.
Set-up
The blue car moves towards the red car while the red cart also moves in the opposite direction. The hit each other and stick to each other. They move a little bit to the right after the collision.
Momentum Bar Chart
All the blocks in the graph should be in the opposite direction of its original position.
Lab Description:
The blue cart (A) starts off moving in the negative direction, while the red cart (B) begins traveling with a positive velocity. In this particular setup, the Cart B has a greater speed than Cart A. Both cars are traveling towards each other until they collide. When the carts collide, the magnet between the carts will attach them together, and therefore, after the collision, two carts will be moving in the positive direction together with the same amount of momentum.
*No external impulse is added to the carts-track system, therefore
J = 0 kg*m/s.
Raw Data
The following are the graphs created on Logger Pro using video analysis. Since video analysis can only analyze one cart's motion at a time, the first graph will display the position and velocity of the blue cart and the second graph will display the position and velocity of the red cart.
The following are the graphs created on Logger Pro using video analysis. Since video analysis can only analyze one cart's motion at a time, the first graph will display the position and velocity of the blue cart and the second graph will display the position and velocity of the red cart.
Raw Data Graph for the Blue Cart (The top one is the velocity-time graph. The bottom one is the position-time graph)
Raw Data Graph for the Red Cart (The top one is the velocity-time graph. The bottom one is the position-time graph)
Processed Data
Next, we reorganize and consolidate the two graphs into one combined graph using Desmos.
blue solid line --> position of Cart A. red solid line --> position of Cart B
blue dashed line --> velocity of Cart A. red dashed line --> velocity of Cart B
blue dotted line --> momentum of Cart A. red dotted line --> momentum of Cart B
purple solid line --> momentum of the system
Next, we reorganize and consolidate the two graphs into one combined graph using Desmos.
blue solid line --> position of Cart A. red solid line --> position of Cart B
blue dashed line --> velocity of Cart A. red dashed line --> velocity of Cart B
blue dotted line --> momentum of Cart A. red dotted line --> momentum of Cart B
purple solid line --> momentum of the system
Calculations
Final Momentum = Mass(a) * Vf(a) + Mass(b) * Vf(b)= 0.256 kg * (-0.1264) m/s + 0.256 kg * (-0.1643) m/s= -0.0744192 kg*m/s
% Difference = |-0.0744192 - (-0.0339172 )| / -0.0339172 = 1.190656%
- pi(a) + pi(b) = pf(a) + pf(b)
- MVi(a) + MVi(b) = MVf(a) + MVf(b)
Final Momentum = Mass(a) * Vf(a) + Mass(b) * Vf(b)= 0.256 kg * (-0.1264) m/s + 0.256 kg * (-0.1643) m/s= -0.0744192 kg*m/s
% Difference = |-0.0744192 - (-0.0339172 )| / -0.0339172 = 1.190656%
Conclusion
What we are trying to prove is that the momentum will always be conserved when there is no external force applied. If momentum is conserved throughout, the total momentum of the system should be the same before and after the collision. In Scenario 4, based on the graphs and calculation, the initial momentum of the system is (pi(a) + pi(b)) -0.0339172 kg*m/s. After the collision, the carts are attached together, so both carts will have the same momentum, the total final momentum of the system is -0.0744192 kg*m/s based on our calculation. We yield a percent difference of 1.190656%, which is very small, meaning our data is actually very accurate. Therefore, we can conclude that momentum is proved to be conserved in Scenario 4. This concept is also proved in the Desmos graph that we created. Since the graph of total momentum (purple solid line) is very close to a straight line throughout the entire process of the lab, this indicates that the amount of momentum does not change and therefore proves again that momentum is conserved.
What we are trying to prove is that the momentum will always be conserved when there is no external force applied. If momentum is conserved throughout, the total momentum of the system should be the same before and after the collision. In Scenario 4, based on the graphs and calculation, the initial momentum of the system is (pi(a) + pi(b)) -0.0339172 kg*m/s. After the collision, the carts are attached together, so both carts will have the same momentum, the total final momentum of the system is -0.0744192 kg*m/s based on our calculation. We yield a percent difference of 1.190656%, which is very small, meaning our data is actually very accurate. Therefore, we can conclude that momentum is proved to be conserved in Scenario 4. This concept is also proved in the Desmos graph that we created. Since the graph of total momentum (purple solid line) is very close to a straight line throughout the entire process of the lab, this indicates that the amount of momentum does not change and therefore proves again that momentum is conserved.
Scenario 5 - "Explosion" (neither is moving, then both are moving)
Set-up
Set-up
Momentum Bar Chart
All the blocks should be in their opposite direction.
Lab Description:
To start with, both carts are stationary in the middle of the track. The carts are connected by a button. If you press on the button and release the carts, the carts are going to start traveling away from each other with the same speed in opposite directions. In this scenario, the system starts with no momentum.
*No external impulse is added to the carts-track system, therefore
J = 0 kg*m/s.
Raw Data
The following are the graphs created on Logger Pro using video analysis. Since video analysis can only analyze one cart's motion at a time, the first graph will display the position and velocity of the blue cart and the second graph will display the position and velocity of the red cart.
The following are the graphs created on Logger Pro using video analysis. Since video analysis can only analyze one cart's motion at a time, the first graph will display the position and velocity of the blue cart and the second graph will display the position and velocity of the red cart.
Raw Data Graph for the Blue Cart (The top one is the velocity-time graph. The bottom one is the position-time graph)
Raw Data Graph for the Red Cart (The top one is the velocity-time graph. The bottom one is the position-time graph)
Processed Data
Next, we reorganize and consolidate the two graphs into one combined graph using Desmos.
blue solid line --> position of Cart A. red solid line --> position of Cart B
blue dashed line --> velocity of Cart A. red dashed line --> velocity of Cart B
blue dotted line --> momentum of Cart A. red dotted line --> momentum of Cart B
purple solid line --> momentum of the system
Next, we reorganize and consolidate the two graphs into one combined graph using Desmos.
blue solid line --> position of Cart A. red solid line --> position of Cart B
blue dashed line --> velocity of Cart A. red dashed line --> velocity of Cart B
blue dotted line --> momentum of Cart A. red dotted line --> momentum of Cart B
purple solid line --> momentum of the system
Calculations
Final Momentum = Mass(a) * Vf(a) + Mass(b) * Vf(b)= 0.256 kg * (-0.8269) m/s + 0.256 kg * 0.7643m/s= -0.01656 kg*m/s
% Difference = |-0.01656 - 0| / 0 = 0 %
- 0 kg*m/s = pf(a) + pf(b)
- - pf(a) = pf(b)
- - MVf(a) = MVf(b)
Final Momentum = Mass(a) * Vf(a) + Mass(b) * Vf(b)= 0.256 kg * (-0.8269) m/s + 0.256 kg * 0.7643m/s= -0.01656 kg*m/s
% Difference = |-0.01656 - 0| / 0 = 0 %
Conclusion
What we are trying to prove is that the momentum will always be conserved when there is no external force applied. If momentum is conserved throughout, the total momentum of the system should be the same before and after the collision. In Scenario 5, based on the graphs and calculation, the system starts with a momentum of 0 kg*m/s, which makes sense because both nothing in the system is moving so there is no momentum. After the carts are released from the attachment, the carts start to move in opposite directions with the exact same speed. This results in the fact that the total momentum of the system is -0.01656 kg*m/s. Our percent difference is 0%. When we look at the combined graph on Desmos, the momentum V.S. time graph (purple solid line) lays on the x-axis throughout the entire lab process. Therefore, we can conclude that momentum is proved to be conserved in Scenario 5.
What we are trying to prove is that the momentum will always be conserved when there is no external force applied. If momentum is conserved throughout, the total momentum of the system should be the same before and after the collision. In Scenario 5, based on the graphs and calculation, the system starts with a momentum of 0 kg*m/s, which makes sense because both nothing in the system is moving so there is no momentum. After the carts are released from the attachment, the carts start to move in opposite directions with the exact same speed. This results in the fact that the total momentum of the system is -0.01656 kg*m/s. Our percent difference is 0%. When we look at the combined graph on Desmos, the momentum V.S. time graph (purple solid line) lays on the x-axis throughout the entire lab process. Therefore, we can conclude that momentum is proved to be conserved in Scenario 5.
Uncertainties...
- By using video analysis, it is possible to get approximate slope since there is human error when clicking the points.
- We ignored friction even though there is some small friction happening between the carts and the surface. a small part of energy will still be lost to the environment, resulting in a decrease in the speed, which will ultimately affect the momentum of the object.
- In our calculation, we are using decimals, which means that we are not getting exact value for the results.
Widget is loading comments...
