Research Question: How does time a marble rolls on a slide affect the distance the marble travels?
Design of the Experiment
The Controlling variables:
We decided to use the same marble throughout because different balls have different mass and speed, which might significantly affect the accuracy of the results of the lab. We also decided to keep the surface the marble rolls on as a constant because different surfaces gives different fractions, which will also greatly affect the speed of the marble and cause the collecting of the inaccurate results.
Lab Materials:
Data Collection:
30 degrees
40 degrees
Different angles has different results. Our procedures and results of all three angles are listed below.
-------------------------------------------------------------------------------------------------------------------------------------------------------------------------------------------------------------------------
20 degrees
Procedures
Lab Set-Up
- Independent Variable: the amount of time the marble rolls
- Dependent Variable: the distance the marble travels
- Controls: The same marble throughout the experiment and the same surface the marble travels on
The Controlling variables:
We decided to use the same marble throughout because different balls have different mass and speed, which might significantly affect the accuracy of the results of the lab. We also decided to keep the surface the marble rolls on as a constant because different surfaces gives different fractions, which will also greatly affect the speed of the marble and cause the collecting of the inaccurate results.
Lab Materials:
- Computer (with LoggerPro)
- Motion Detector
- Iron slide
- Marble
Data Collection:
- Considering the factors that it might be hard for us to stop the ball at a perfect timing and it is also difficult to measure the accurate distance the marble travels, we decided to use the motion detector to record the motion of the ball when it's rolling down the ramp for more confident data sets.
- Also, in order to discover the variety of the results, we did the experiments three times with different angles of the ramp, which includes angles:
30 degrees
40 degrees
Different angles has different results. Our procedures and results of all three angles are listed below.
-------------------------------------------------------------------------------------------------------------------------------------------------------------------------------------------------------------------------
20 degrees
Procedures
- Put the motion detector on the upper end of the ramp.
- Set the angle of the ramp to 20 degrees.
- Start the marble in the air at the place where is 10cm away from the motion detector and set the marble down as the time starts running.
- Let the motion detector record the motion.
- Catch the ball before it falls down to the ground.
- Cut off the linear part of the graph that the motion detector created on LoggerPro.
- Find the line of the best fit.
- List the equation.
- Use the equation to find the relationship between the time and the distance traveled.
Lab Set-Up
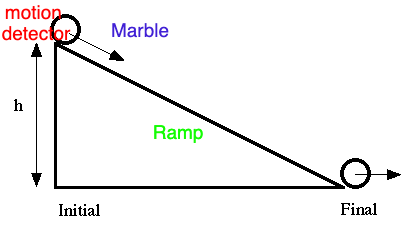
The angle is 20 degrees. (Lab Set-Up)
|

Data collected and the equation that was generated by LoggerPro. X= time (s), Y=distance (m) (Raw and Processed Data)
|
Raw and Processed Data:
In this experiment, we used a table to record our chosen time period in seconds, and the distance the marble traveled in meters. In order to get the results as accurate as possible, we only kept the data points that were not influenced by the human actions, such as pushing and stopping. Due to the situation that we only have a short ramp, the available time period is less than expected. In order to get our raw data, we used the data points that were collected by the motion detector. Then, we use LoggerPro to find the equation so we will be able to find the available data points in the long term. The uncertainty of the data is 0.03m.
Graph of the Collected Data:
- This graph of the collected data clearly shows a strong quadratic progression.
- Since the marble is going down, there will be acceleration on it.
- If there is acceleration, the position time graph is going to be quadratic because the velocity of the marble is changing.
- y_2~ax_2^2-bx_2+c
- a=0.472
- b=-0.3204
- c=0.1366
- We think that the data collected by a motion detector will have uncertainties such as human reaction time for the starting and ending part. Moreover, when a person is trying to cut off the graph, it will affect the equation since the part of the graph decides a, b, and c in the equation.
Position vs. Time graph of the collected data. X axis represents the time, the unit is second.
Y axis represents the distance traveled, the unit is meters.
30 degrees
Procedures
Raw and Processed Data:
In this experiment, we used a table to record our chosen time period in seconds, and the distance the marble traveled in meters. In order to get the results as accurate as possible, we only kept the data points that were not influenced by the human actions, such as pushing and stopping. Due to the situation that we only have a short ramp, the available time period is less than expected. In order to get our raw data, we used the data points that were collected by the motion detector. Then, we use LoggerPro to find the equation so we will be able to find the available data points in the long term. The uncertainty of the data is also 0.03m. What we changed in this one is that we changed the angle of the ramp from 20 degrees to 30 degrees. We can see that as the degrees get higher, the acceleration becomes bigger. Also, from the equation, we can see that the value of a, b, and c becomes bigger as the result of the changing of the angle.
Graph of the Collected Data:
Procedures
- Put the motion detector on the upper end of the ramp.
- Set the angle of the ramp to 30 degrees.
- Start the marble in the air at the place where is 10cm away from the motion detector and set the marble down as the time starts running.
- Let the motion detector record the motion.
- Catch the ball before it falls down to the ground.
- Cut off the linear part of the graph that the motion detector created on LoggerPro.
- Find the line of the best fit.
- List the equation.
- Use the equation to find the relationship between the time and the distance traveled.
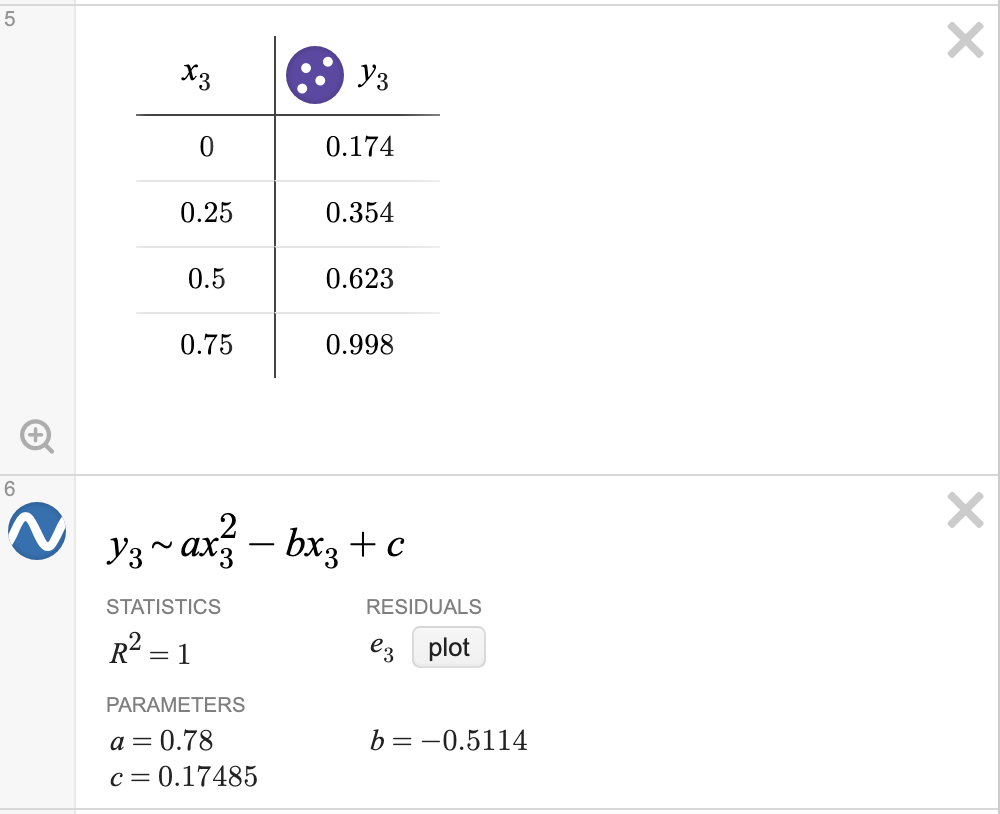
Raw and Processed Data:
In this experiment, we used a table to record our chosen time period in seconds, and the distance the marble traveled in meters. In order to get the results as accurate as possible, we only kept the data points that were not influenced by the human actions, such as pushing and stopping. Due to the situation that we only have a short ramp, the available time period is less than expected. In order to get our raw data, we used the data points that were collected by the motion detector. Then, we use LoggerPro to find the equation so we will be able to find the available data points in the long term. The uncertainty of the data is also 0.03m. What we changed in this one is that we changed the angle of the ramp from 20 degrees to 30 degrees. We can see that as the degrees get higher, the acceleration becomes bigger. Also, from the equation, we can see that the value of a, b, and c becomes bigger as the result of the changing of the angle.
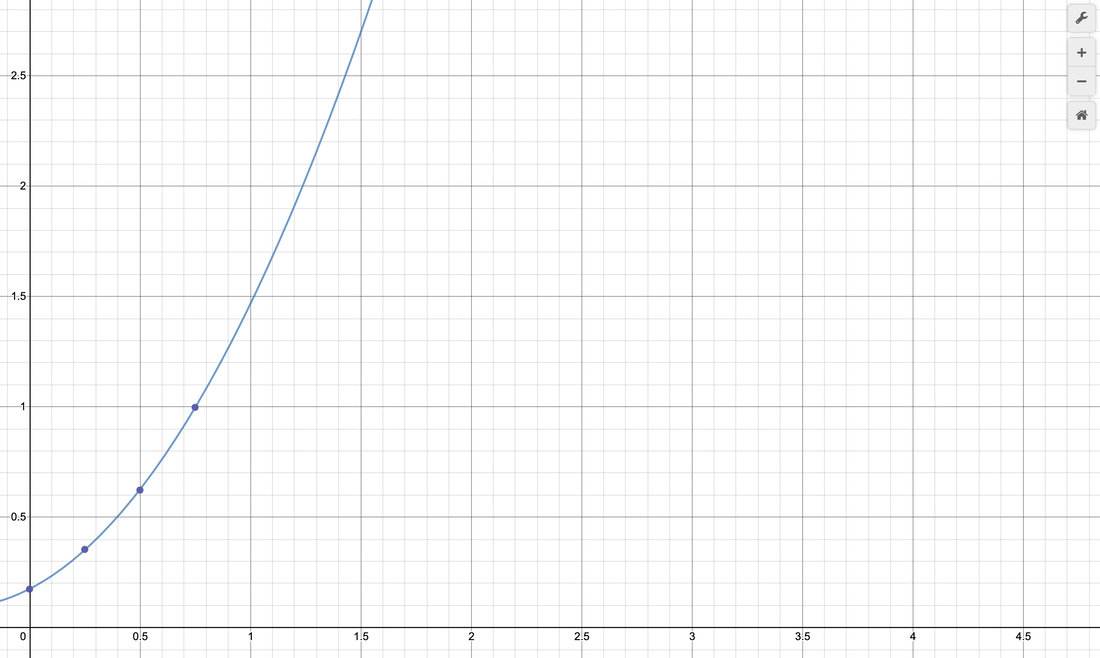
Graph of the Collected Data:
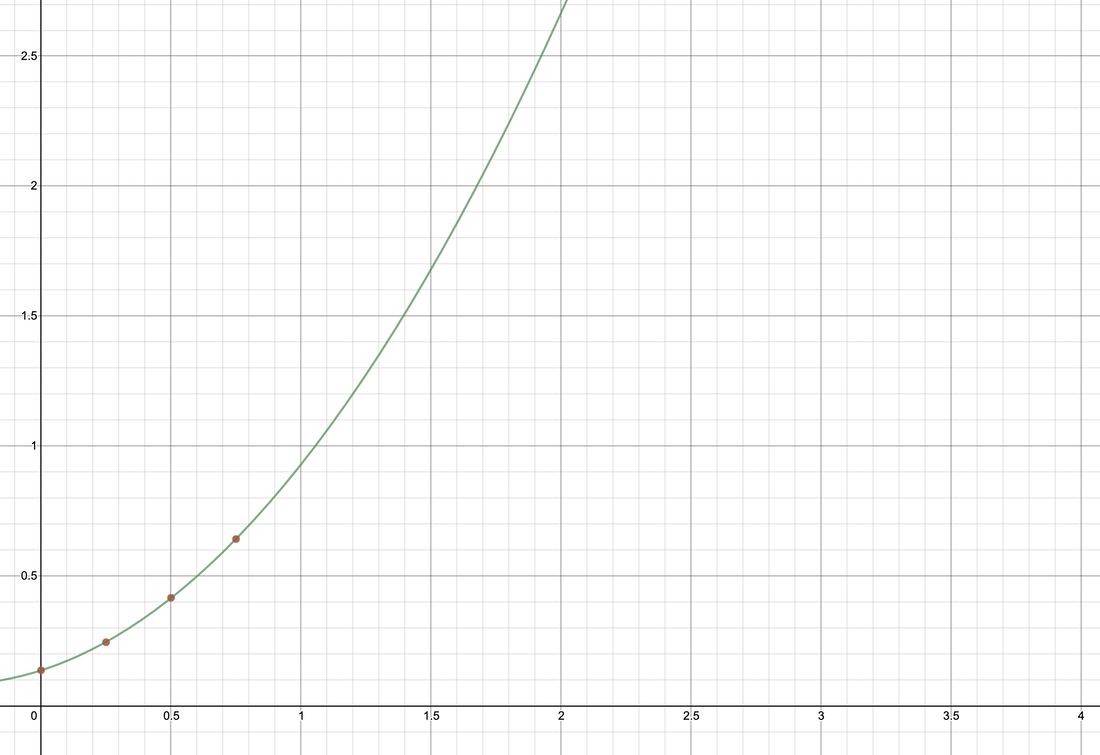
- This graph of the collected data clearly shows a strong quadratic progression.
- Since the marble is going down, there will be acceleration on it.
- As the angle gets bigger, acceleration becomes higher.
- If there is acceleration, the position time graph is going to be quadratic because the velocity of the marble is changing.
- y_2~ax_2^2-bx_2+c
- a=0.78
- b=-0.5114
- c=0.17485
- We think that the data collected by a motion detector will have uncertainties such as human reaction time for the starting and ending part. Moreover, when a person is trying to cut off the graph, it will affect the equation since the part of the graph decides a, b, and c in the equation.
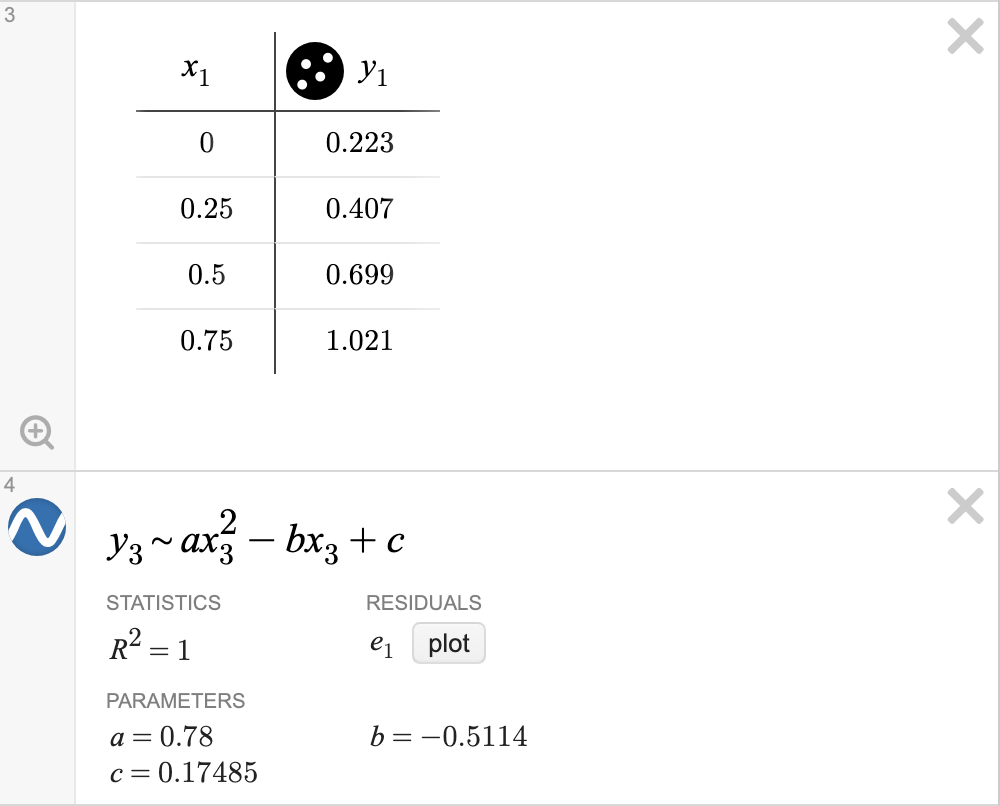
Data collected and the equation that was generated by LoggerPro. X= time (s), Y=distance (m) (Raw and Processed Data)
|
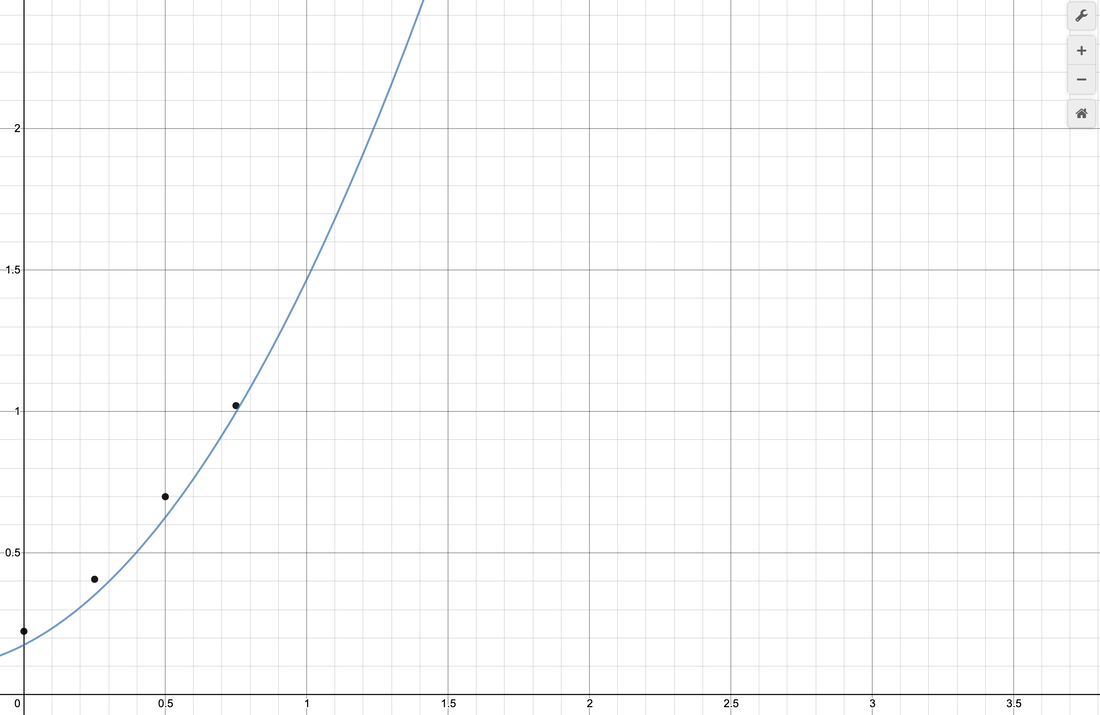
Position vs. Time graph of the collected data. X axis represents the time, the unit is second. Y axis represents the distance traveled, the unit is meters.
|
40 degrees
Procedures
Raw and Processed Data:
In this experiment, we used a table to record our chosen time period in seconds, and the distance the marble traveled in meters. In order to get the results as accurate as possible, we only kept the data points that were not influenced by the human actions, such as pushing and stopping. Due to the situation that we only have a short ramp, the available time period is less than expected. In order to get our raw data, we used the data points that were collected by the motion detector. Then, we use LoggerPro to find the equation so we will be able to find the available data points in the long term. The uncertainty of the data is also 0.03m. What we changed in this one is that we changed the angle of the ramp from 30 degrees to 40 degrees.
Graph of the Collected Data:
Procedures
- Put the motion detector on the upper end of the ramp.
- Set the angle of the ramp to 40 degrees.
- Start the marble in the air at the place where is 10cm away from the motion detector and set the marble down as the time starts running.
- Let the motion detector record the motion.
- Catch the ball before it falls down to the ground.
- Cut off the linear part of the graph that the motion detector created on LoggerPro.
- Find the line of the best fit.
- List the equation.
- Use the equation to find the relationship between the time and the distance traveled.
Raw and Processed Data:
In this experiment, we used a table to record our chosen time period in seconds, and the distance the marble traveled in meters. In order to get the results as accurate as possible, we only kept the data points that were not influenced by the human actions, such as pushing and stopping. Due to the situation that we only have a short ramp, the available time period is less than expected. In order to get our raw data, we used the data points that were collected by the motion detector. Then, we use LoggerPro to find the equation so we will be able to find the available data points in the long term. The uncertainty of the data is also 0.03m. What we changed in this one is that we changed the angle of the ramp from 30 degrees to 40 degrees.
Graph of the Collected Data:
- This graph of the collected data clearly shows a strong quadratic progression.
- Since the marble is going down, there will be acceleration on it.
- As the angle gets bigger, acceleration becomes higher.
- If there is acceleration, the position time graph is going to be quadratic because the velocity of the marble is changing.
- y_2~ax_2^2-bx_2+c
- a=0.78
- b=-0.5114
- c=0.17485
- What we can notice is that the a, b, and c values do not change at this moment and starts to fit the function perfectly. However, when the ramp was at 30 degrees, the line did not fit the points perfectly. It might indicates that the acceleration at this time do not change much.
- We think that the data collected by a motion detector will have uncertainties such as human reaction time for the starting and ending part. Moreover, when a person is trying to cut off the graph, it will affect the equation since the part of the graph decides a, b, and c in the equation.
Data collected and the equation that was generated by LoggerPro. X= time (s), Y=distance (m) (Raw and Processed Data)
|
Position vs. Time graph of the collected data. X axis represents the time, the unit is second. Y axis represents the distance traveled, the unit is meters.
|
Conclusion:
According to the data and the graph from all three angles of data collection, we are very confident to suggest that the position of the marble is quadratically related to the time the marble rolls. As you can see from the graph, as the angle gets larger and larger, the function is also getting steeper and steeper, which means that the acceleration is getting larger and larger. All quadratic progression do not have the constant slopes.The y-intercept of the graph tells us the initial position, which is the position of the marble when time is ZERO. In our experiments, the y-intercept for the angle of 20 degrees (0.1366 m) is different from the angle of 30 degrees and 40 degrees (0.17485 m). It is because the place we land the marble is different for the first experiment than the other two sets because of the human errors. We generated the tables and graphs and equations to illustrate all of three experiments, which tells us that graphs and equations are very useful in modeling a motion. IN this particular experiment, we found out the general equation to model the relationship between the position and a quadratically moving object:
y_s~ax_s^2-bx_s+c
Evaluating Procedures and Uncertainties:
- Uncertainties:
- Reaction time - When I was using the motion detectors, I will not be able to hit the start and end button at the same as the marble starts rolling or ends rolling because I have to take some time react to it. This reaction time might cause the uncertainties in the datA.
- Starting point: As mentioned in the conclusion, the distance between the starting point and the motion detector is different for the first one. It is because of the imprecise measurement by us.
- Cutting the graph: The range for me to cut the valuable information from the graph the motion detector gives to me will also affect the accuracy of the data.
- Improving the Investigation:
- Combine two ramps together to create a longer distance for the marble to roll;
- For more accurate data, we should do the same one for three times and get the average of them;
- We should measure the distance more precisely.
- Combine two ramps together to create a longer distance for the marble to roll;
Widget is loading comments...
